SaaS retention rate is the percentage of customers you keep over a set period, usually a year.
Start the year with 500 customers, finish with 460 still paying, and your retention rate is 92%.
That one number decides whether your growth compounds or leaks.
Every customer who leaves has to be replaced before you grow at all, and the latest data shows the leak getting bigger: median gross revenue retention for B2B SaaS fell from 88% to 84% in 2025, according to the 2026 Aleph and Benchmarkit report.
This guide covers the formula, a worked example, 2026 benchmarks by segment, and seven ways to improve your retention rate.
It also shows what to track inside your product, because billing data tells you who left and product data tells you who is about to.
SaaS Retention Rate at a Glance
- Formula: Retention rate = ((E - N) / S) x 100, where E is customers at the end, N is new customers added, and S is customers at the start.
- Retention vs churn: the two always add up to 100%.
- A good rate: 85% or more annual gross revenue retention is solid, and 90% or more is top tier.
- Net revenue retention: the median is 102%, so the typical B2B SaaS company grows only about 2% from existing customers.
- Segment matters: sales-led companies post a median of 88% gross revenue retention; product-led companies 79%.
- Where to look: billing data shows who left; product usage data shows who is at risk.
What Is SaaS Retention Rate?
SaaS retention rate measures how many customers, or how much recurring revenue, you keep from the start of a period to the end.
New customers do not count. The question is simple: of the customers I had at the start, how many are still here?
You will see three versions:
- Customer (logo) retention rate: the share of customers you kept.
- Gross revenue retention (GRR): the share of recurring revenue you kept, ignoring upgrades. It can’t go above 100%.
- Net revenue retention (NRR): the share of recurring revenue you kept, including upgrades and add-ons. It can go above 100%.
Founders usually mean the first one. Investors usually care about the other two.
Track all three, because they can tell different stories.
Retention Rate Formula: How to Calculate It
The customer retention rate calculation uses three numbers from the same period. This is the standard formula:
Retention rate = ((E - N) / S) x 100
- S: customers at the start of the period
- E: customers at the end of the period
- N: new customers added during the period
Worked example. A SaaS company starts the year with 500 customers (S), adds 120 new ones (N), and ends the year with 580 (E).
- Subtract new customers from the end count: 580 - 120 = 460.
- Divide by the starting count: 460 / 500 = 0.92.
- Multiply by 100. The retention rate is 92%.
That means 40 customers left, so the churn is 8%.
Mistakes that distort the number:
- Skipping the subtraction: Dividing end customers by start customers (580 / 500) gives 116%. That is growth, not retention.
- Ignoring new customers who churn inside the period: If some of those 120 new customers also left before year-end, the (E - N) shortcut understates retention. For short windows, count how many of your starting customers are still active and divide by S.
- Changing what “customer” means: Decide once whether trials, free plans, and paused accounts count, then keep it fixed.
- Pulling counts from the CRM: Use the billing system for all three numbers so they reconcile with revenue.
Revenue Retention: GRR and NRR Formulas
Customer counts treat a $20 account and a $20,000 account the same.
Revenue retention fixes that. Recurly gives an example where 3% customer churn equals 5% MRR churn, because the accounts lost were worth more than average.
Example. A cohort starts with $50,000 in MRR. Over the year, $3,000 is lost to cancellations, $2,000 to downgrades, and $6,000 is gained from upgrades.
- GRR = ($50,000 - $3,000 - $2,000) / $50,000 = 90%
- NRR = ($50,000 - $3,000 - $2,000 + $6,000) / $50,000 = 102%
Use the same cohort and the same period, and never mix MRR with ARR in one calculation. GRR excludes all expansion and new-customer revenue, so any upsell that leaks in inflates it. For the expansion side, read our guide to net revenue retention.
How to Improve SaaS Retention Rate: 7 Tactics
Retention is built in the first weeks and protected by what you notice afterward. Work down this list in order.
- Get users to first value faster: People who never reach your product’s core value leave early. Recurly names poor onboarding as the single biggest driver of voluntary cancellations. Define the one action that proves a user got value, then measure how long it takes. Our guides on user activation, time-to-value, and onboarding drop-off show how.
- Learn what your retained customers do differently: Compare accounts that stayed with accounts that left, and look for actions only the first group took. That action is a strong candidate for your activation event. See how to identify power users and feature adoption rate.
- Set up early warning signals: Falling logins, unused seats, and abandoned workflows show up weeks before a cancellation. Combine them into a customer health score so your team acts before renewal.
- Fix involuntary churn: Failed payments were about a third of SaaS churn in Recurly’s data, and the fixes are cheap: smart retry schedules, automated dunning emails, and card updater services. Recurly’s research describes each, and none needs a product change.
- Run a renewal playbook for annual plans: Recurly notes that annual plans raise lifetime value but add a high-risk renewal moment. Check usage 60 to 90 days before renewal and reach out where it has gone quiet.
- Ask every cancelling customer why: One required question in the cancellation flow beats guessing. Tag the answers (price, missing feature, never set up, switched tool) and review them monthly next to your usage data.
- Track retention by cohort, not just overall: A blended number hides problems in one group behind healthy numbers in another. Our cohort analysis guide shows how to split users correctly, and a data-driven product roadmap turns what you learn into what you build next.
Retention is the fourth stage of the AARRR framework. Fixing activation upstream usually does more than winning customers back downstream.
How to Track Retention Signals With Vemetric
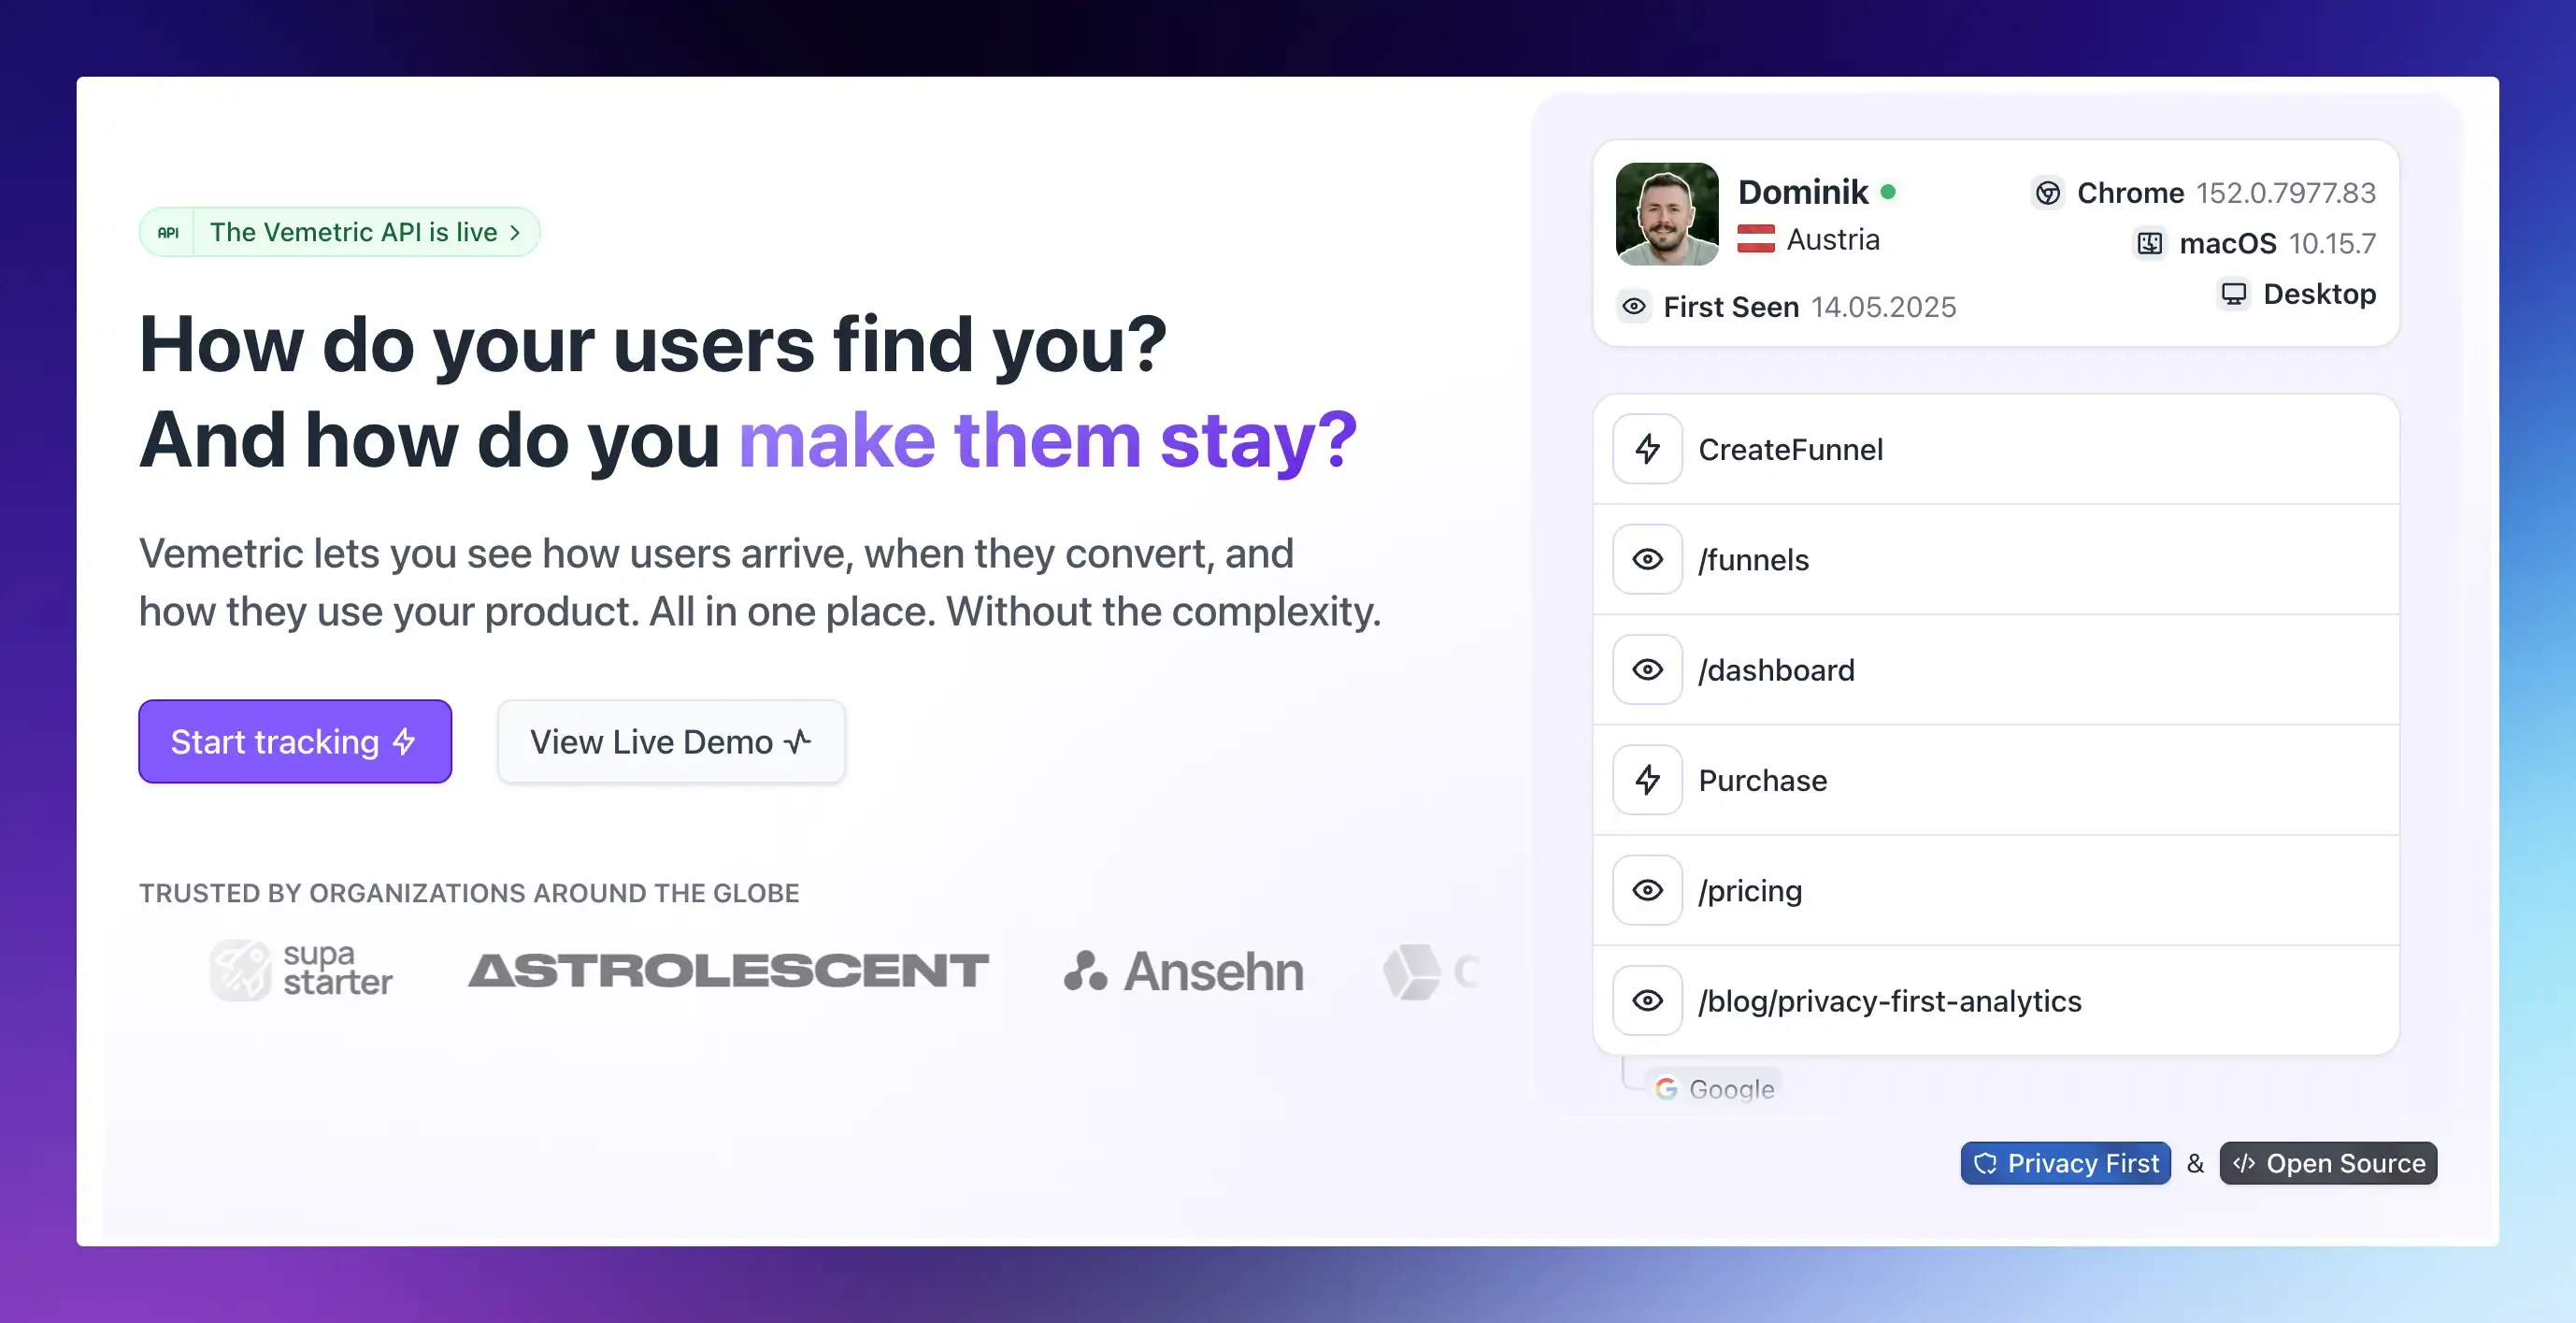
Your billing tool reports retention after the fact. To change it, you need to see behavior while there is still time to act. Vemetric is a privacy-first web and product analytics tool for SaaS teams, and it covers the behavior side:
- Define “active” with custom events: Track the action that shows a customer is getting value, not just a login.
- Save each cohort as a filter: Combine signup date, plan, and events, then save the filter and reuse it across the dashboard, users, events, and funnels.
- Find the drop-off with funnels: Map signup to activation in Funnels and filter by segment to see who stalls.
- Read any user’s story: User Journeys show sessions, events, and an activity heatmap, so you can see when engagement faded.
- Merge anonymous and logged-in activity with user identification.
- Join usage to billing. The REST API lets you pull user and event data into your own sheet or BI tool.
Vemetric is cookie-free by default, hosted in the EU, and open source under AGPLv3, so you can verify how your data is handled.
FAQs
Start with three moves: get new users to first value faster, fix failed-payment churn with retries and dunning emails, and set alerts for accounts whose usage drops. Each one targets a different leak, so you can run them in parallel.
Track it monthly for internal decisions, and use annual or trailing twelve-month figures when comparing against benchmarks. Monthly tracking catches a downward trend before it is a quarter old.