Dashboard
Explore and understand your data with Vemetric’s interactive dashboard.
Once data is flowing to Vemetric, the Dashboard provides an overview of your website or app’s analytics. The dashboard is designed to be intuitive and easy to use, while also offering sophisticated filtering options to get more specific insights.
You can take a look at this live demo to see it in action.
The first time you integrate Vemetric, allow a short time for data to appear. The dashboard updates almost in real-time, but there may be a few seconds of delay for events to be processed.
Key features of the Vemetric dashboard include:
Real-time metrics and charts
Get immediate insight into page views, unique visitors (users), bounce rate and visit duration. Data is presented in interactive charts that update as new events come in.
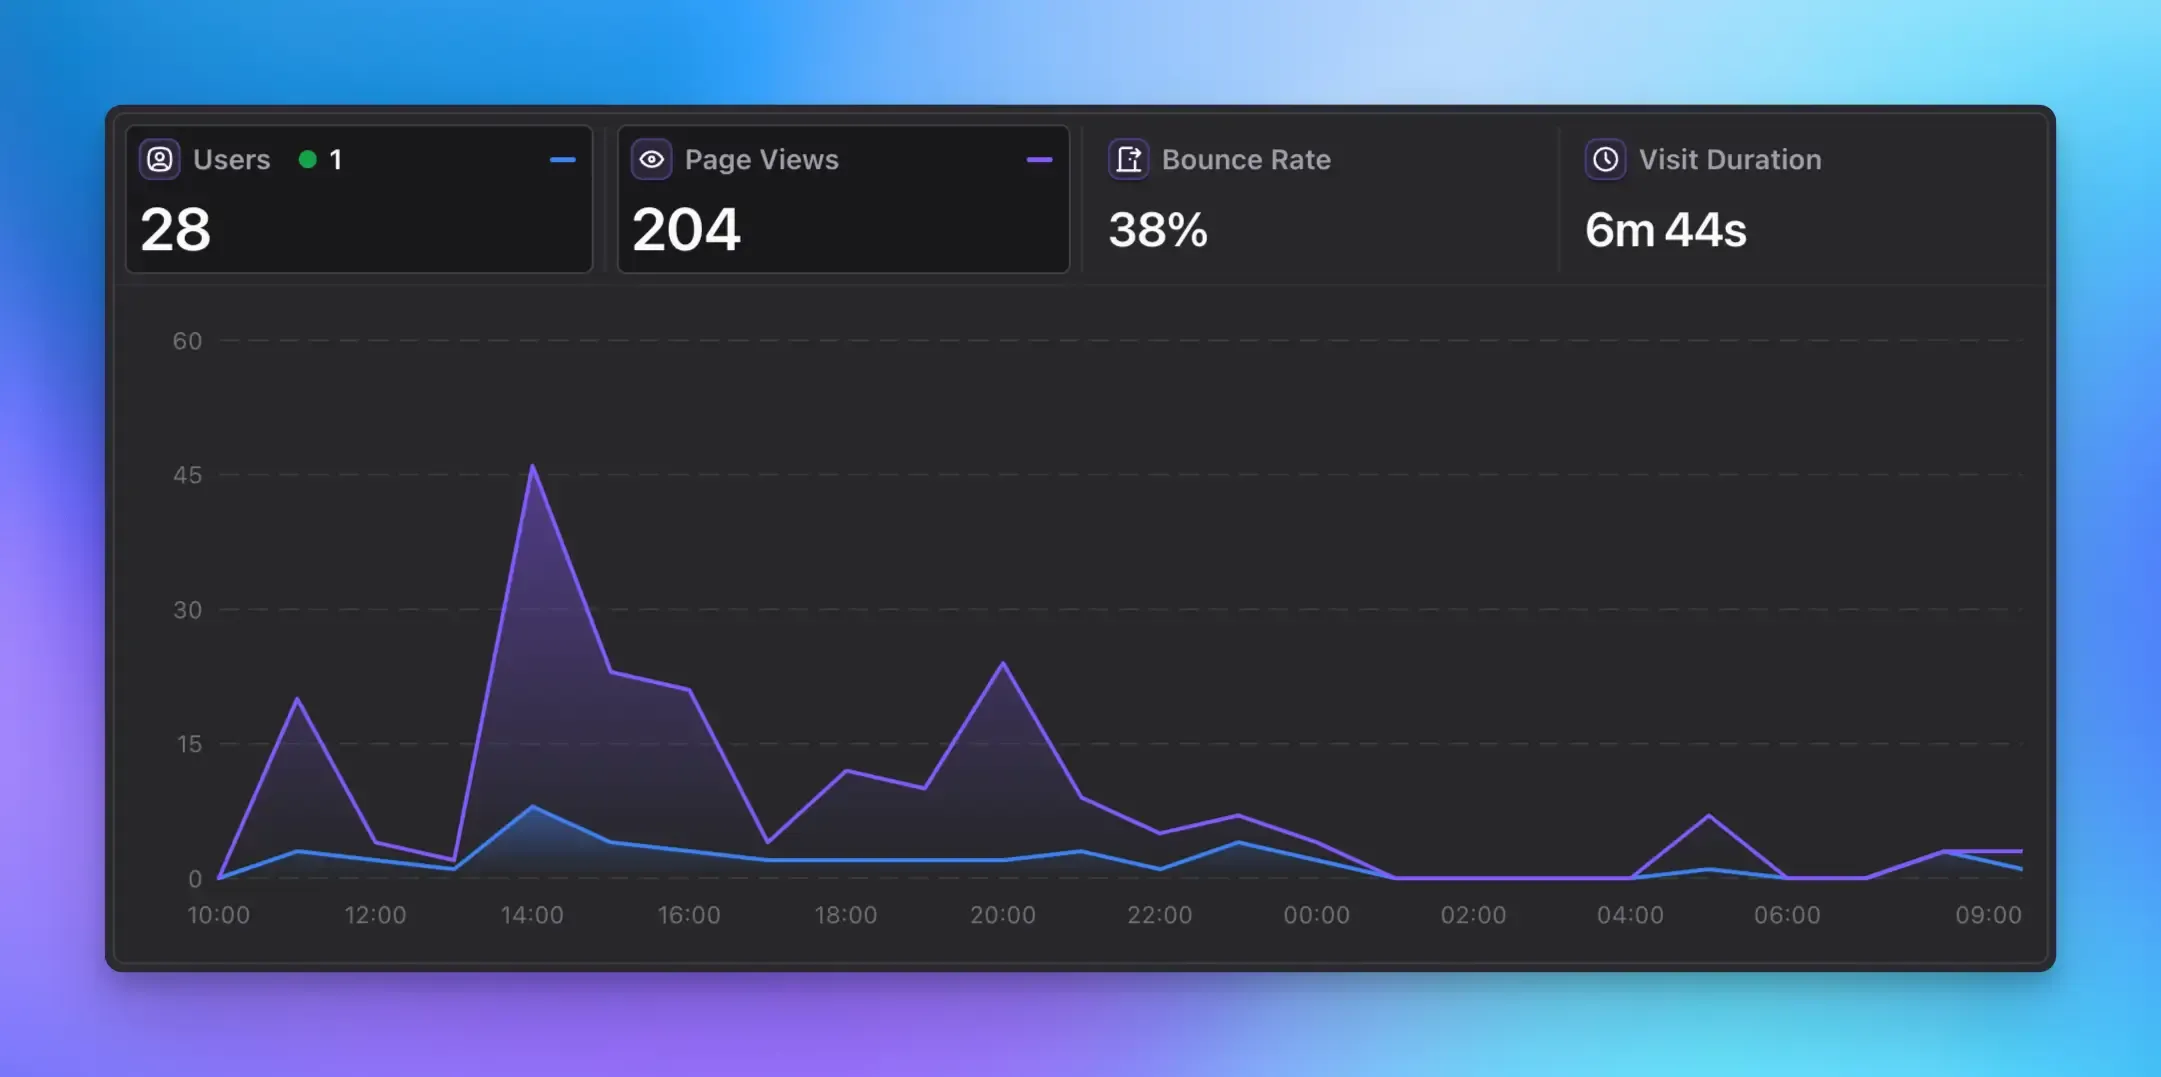
Most popular data
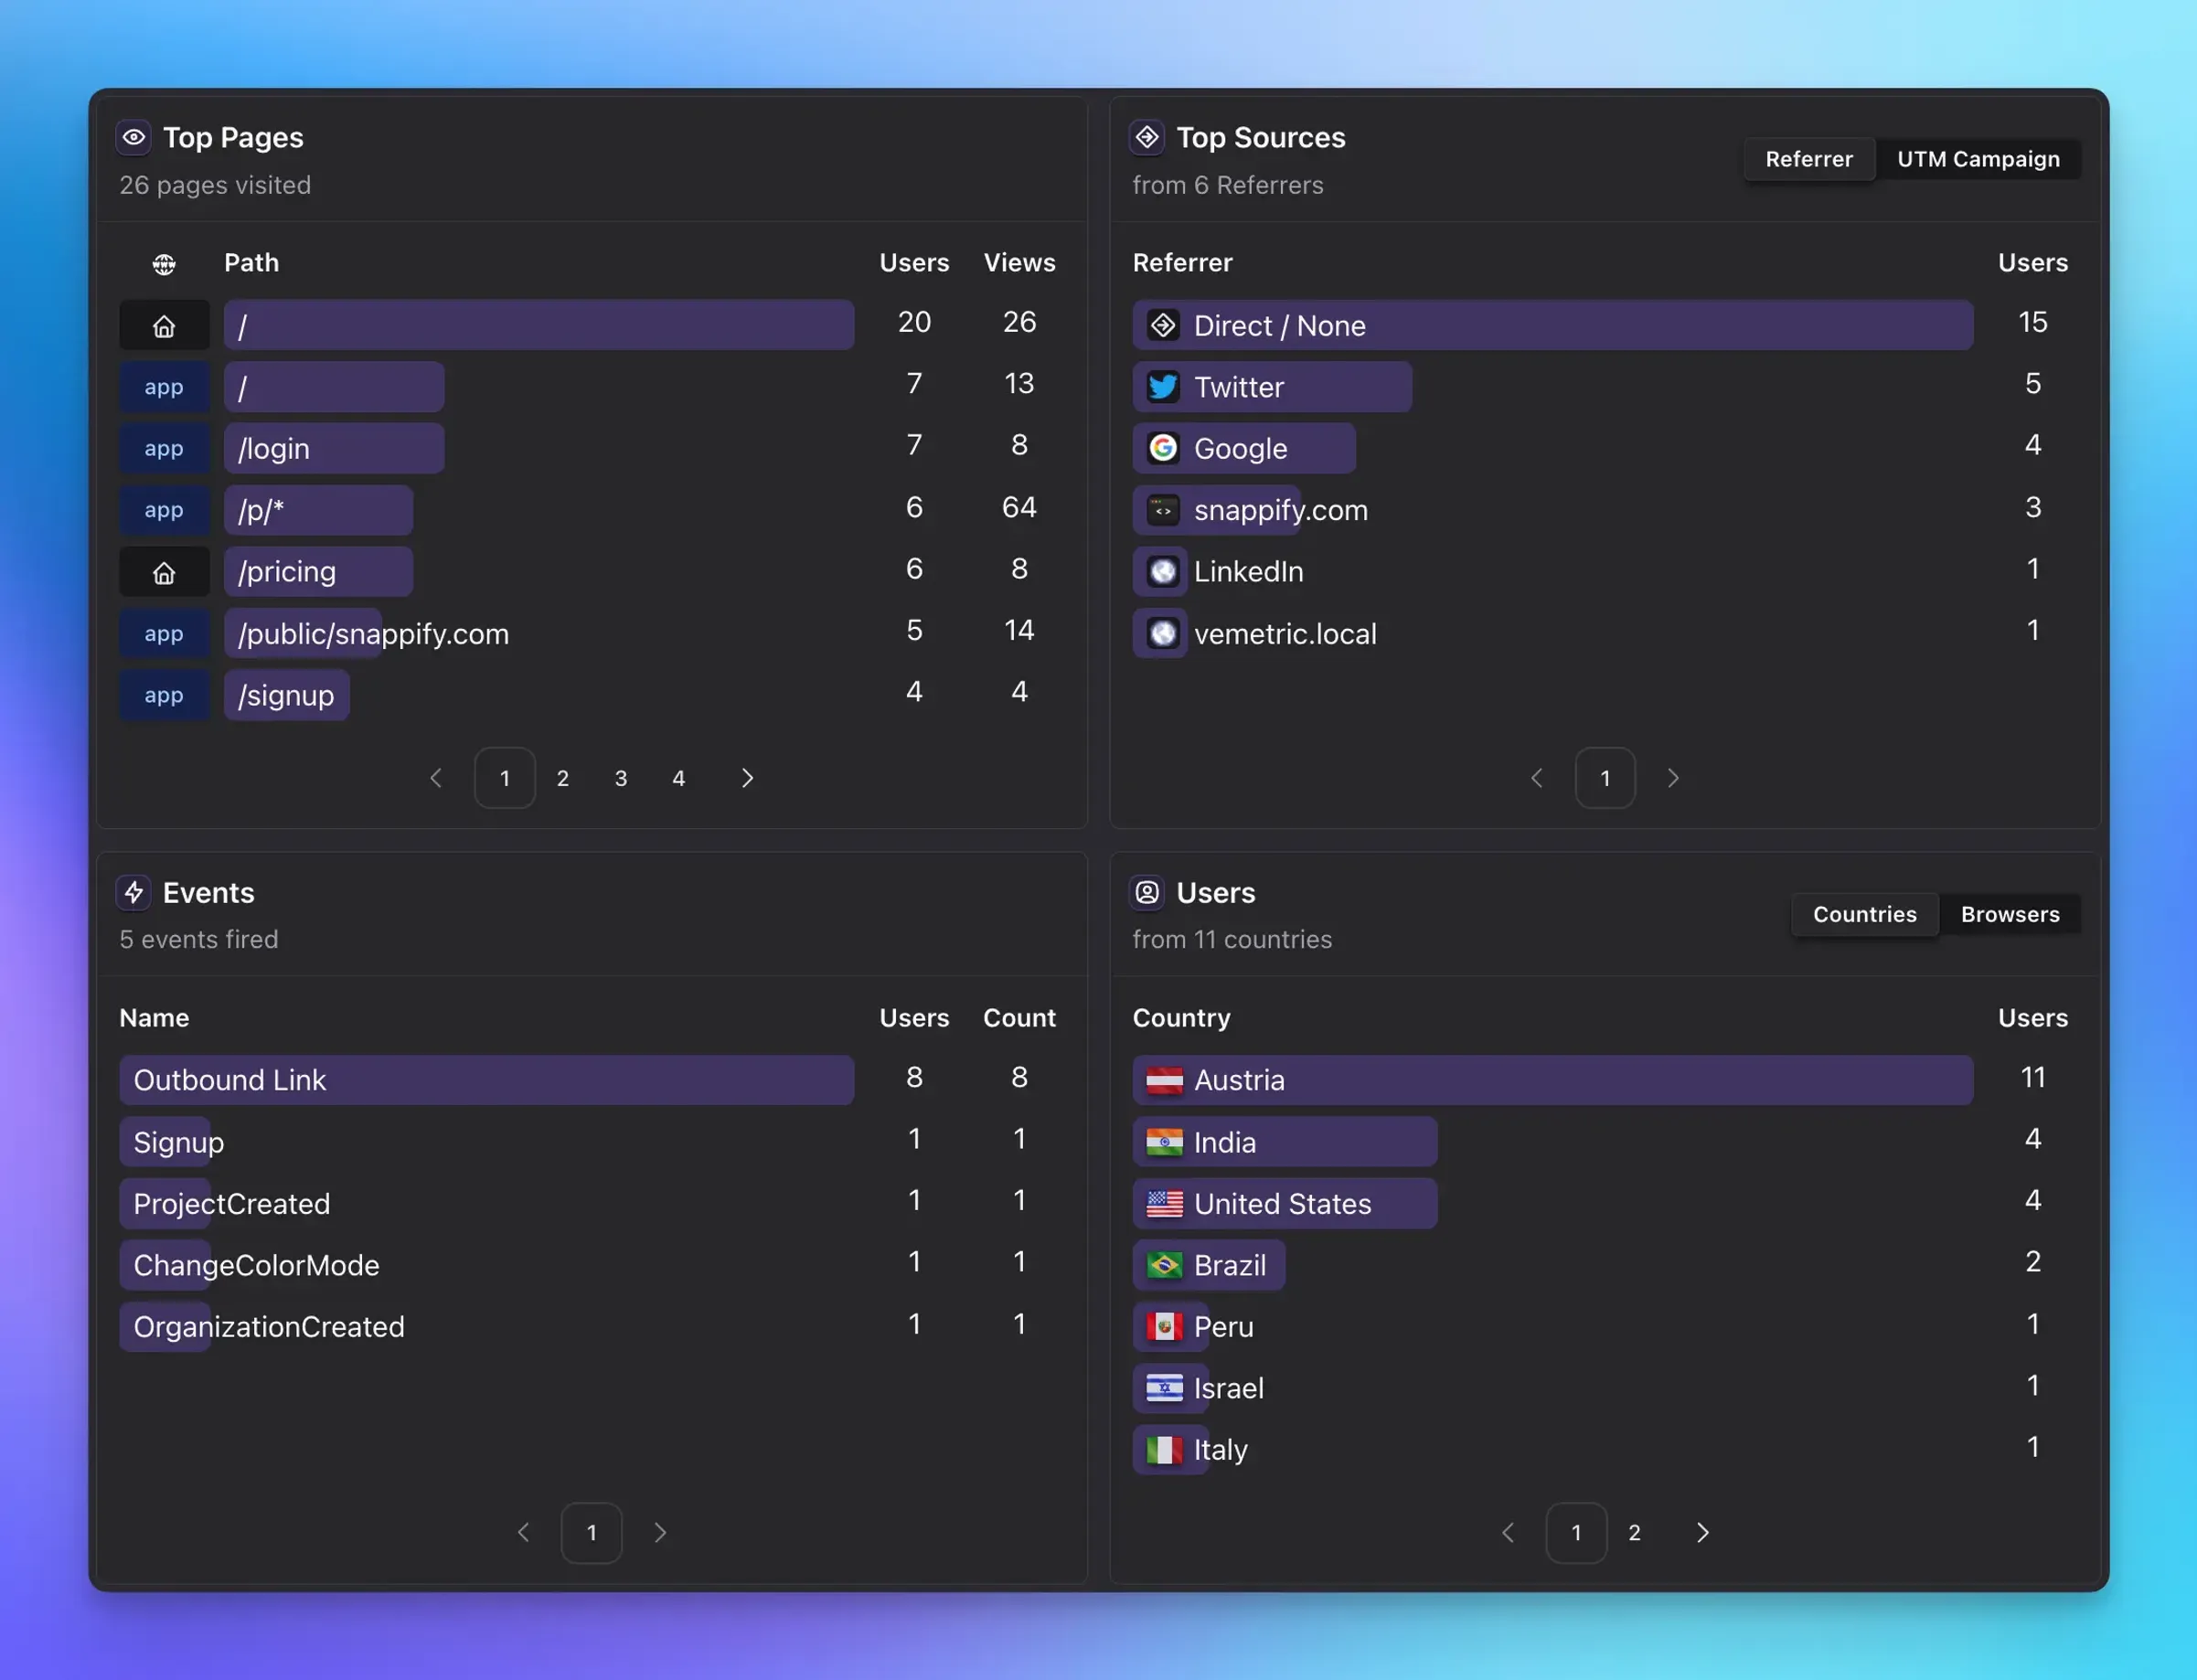
Below the charts you can find the most popular data. This includes the most viewed pages, referrers & utm tags, events and user properties like countries, devices, etc. You can filter for specific values by clicking on them, for more sophisticated filtering take a look at the Filtering and segmentation section.
Also checkout how to track Custom Events in order to see them on the Dashboard. If you want to see individual User Journeys, that’s possible as well.
Filtering and segmentation
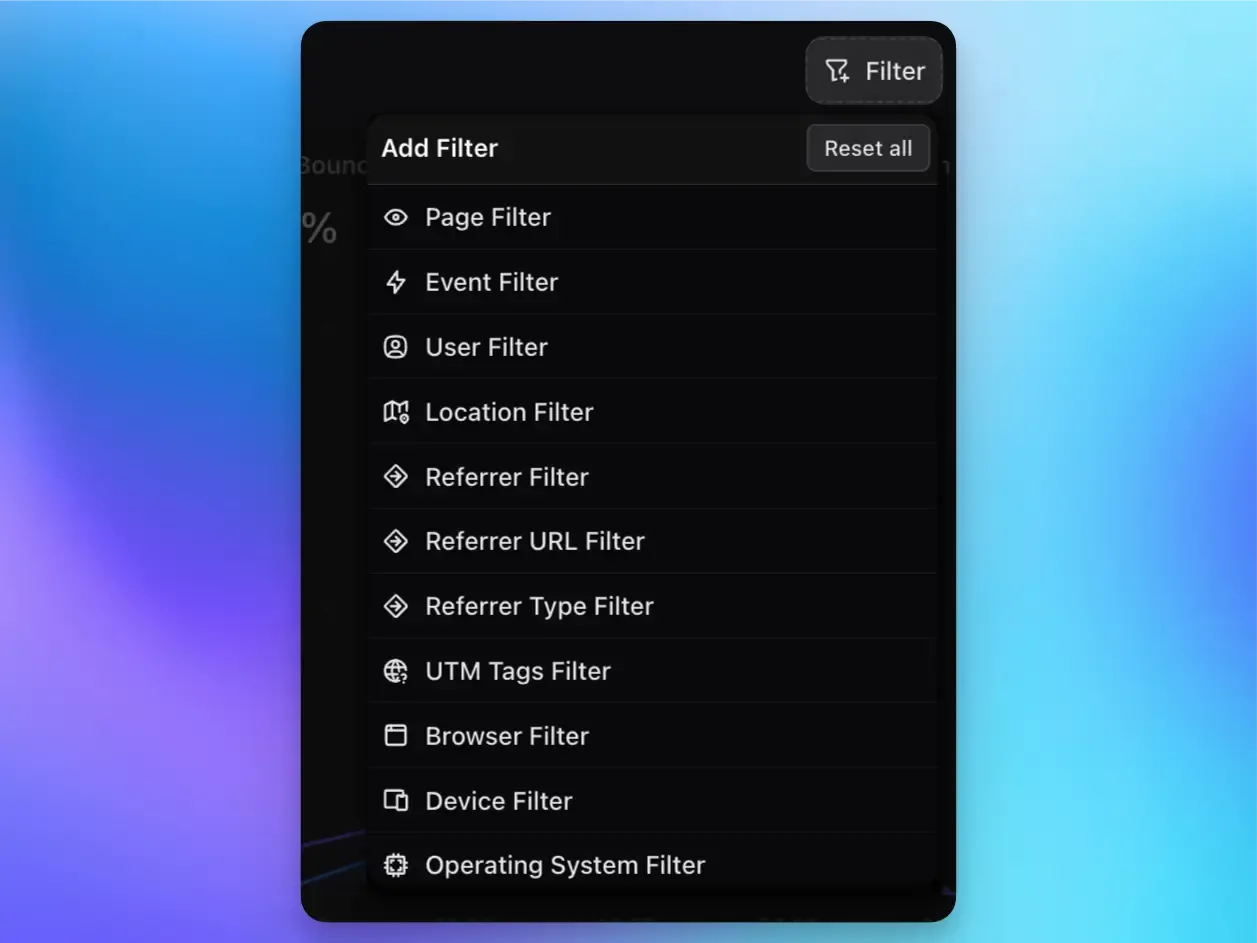
You can filter all the data on the Dashboard by specific criteria. For example, filter for page views where the pathname starts with /blog, by specific event names.
You can also filter by user properties (like country, device type, or custom attributes) to segment your users. These powerful filters make it easy to isolate certain events or user segments, helping you identify trends and gather insights.
For instance, you might filter to see Signup events from users in Canada in the last 7 days, or page views that came via a specific referral campaign.
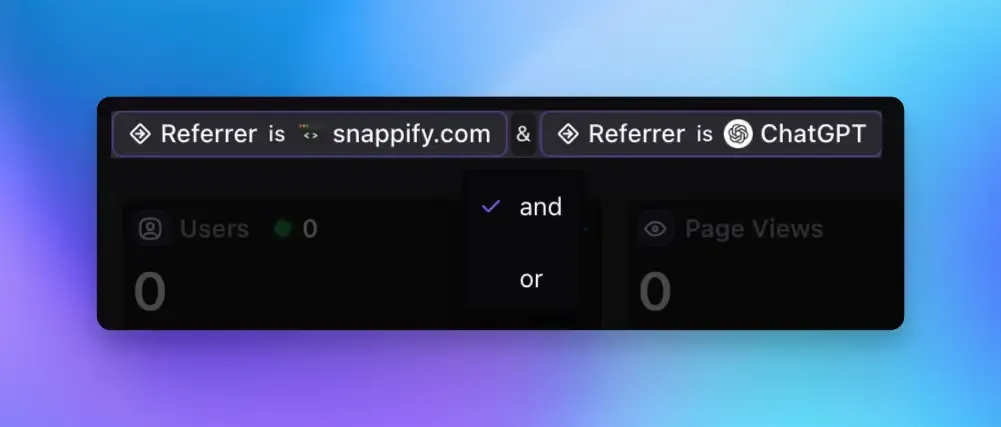
Combine multiple filters
Vemetric allows combining multiple filter conditions (e.g., Event Name is Purchase AND Device Type is mobile). This helps in creating custom segments or cohorts of users for deeper analysis.
Public dashboards
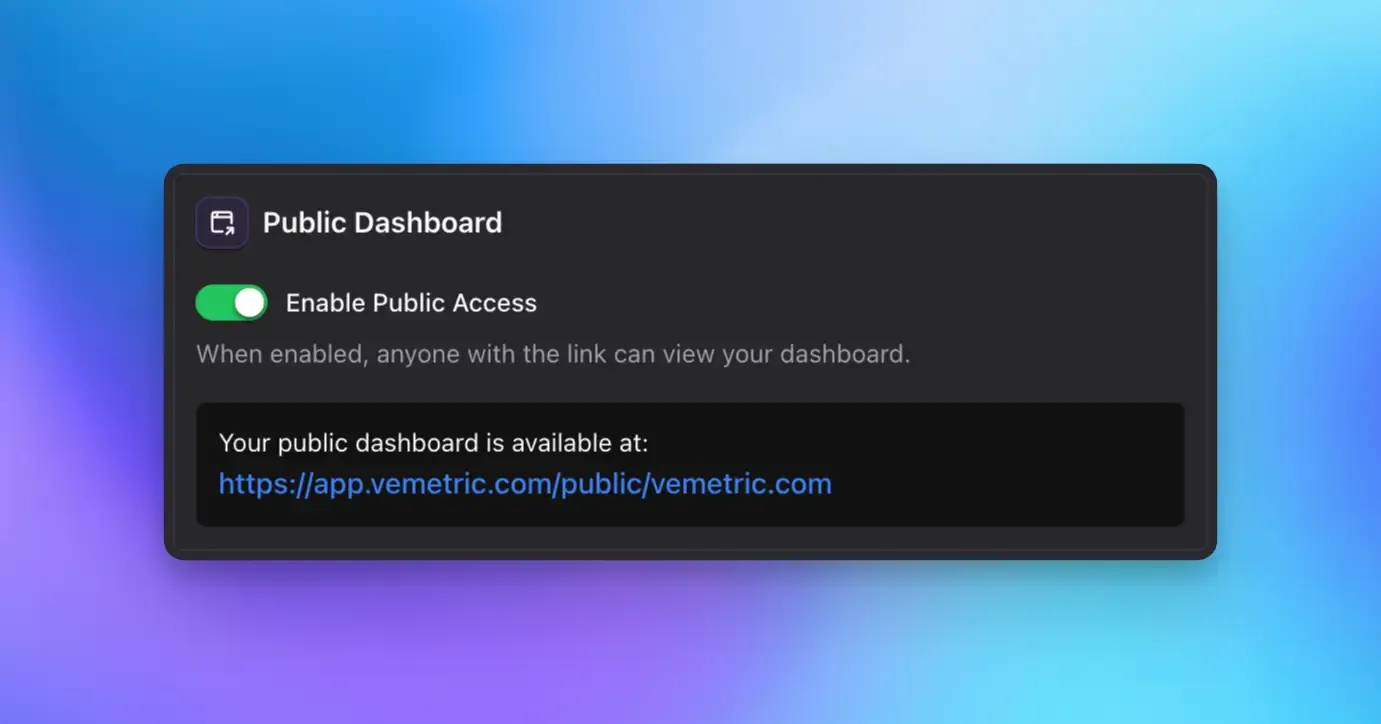
You can make your Dashboard publicly available and share it with others. This is useful for showing your analytics data to clients or external partners. Here you can see an example of a public dashboard.
When making your Dashboard public, this will only open up the data visible on the Dashboard.
Data from individual User Journeys will not be visible to the public.
In order to make your Dashboard public, go to the Settings of your project and toggle the Enable Public Access switch. Then you’ll be able to copy the URL and share it with others.
Easily integrate Vemetric into your React Router application.
Answers to common questions about Vemetric.