Feature Adoption Rate: What It Is and How to Improve It
You launch a new feature, but only a small number of your users ever click on it.
This scenario repeats itself in SaaS companies every single day. The average product team ships features that see only 5-6% adoption.
That means six out of every ten features fall into this category, and only about one in ten reaches meaningful daily usage among 20% or more of users.
These numbers point to a hard truth that just building features does not guarantee anyone will use them. And it comes down to one problem: low feature adoption rate.
For SaaS owners, this metric sits at the center of every major product decision, from what to build next to what to remove from your roadmap.
If you are not tracking it, you are making those decisions without the data you need.
This guide explains what feature adoption rate actually means, why it matters so much, and how you can move it in the right direction.
What Is Feature Adoption Rate?
Feature adoption rate is the percentage of your active users who have used a specific feature within a given time period. It tells you whether a feature you built is actually being used, and by how many people.
It is one of the most important performance metrics because it connects your product decisions to real user behavior. A high feature adoption rate usually means the feature solves a real problem. A low one signals something is off, whether that is discoverability, usability, or relevance.
How to calculate it:
Feature Adoption Rate = (Number of users who used the feature / Total number of active users) x 100
For example, if you have 2,000 active users and 400 of them used your new dashboard feature in the last 30 days, your feature adoption rate is 20%.
A good adoption rate in product analytics depends on your user base and the importance of the feature to your product.
Low adoption typically falls below 20%. High adoption sits above 60% for core features. But these are not rigid rules.
The key is to know your current feature adoption rate, so you have a starting point for making better changes.
Why Feature Adoption Rate Matters
Most product teams track signups, revenue, and churn. But if you are not tracking product feature adoption, you are missing a critical layer of understanding.
A feature might solve a major problem. But if the adoption rate sits at 5 percent after three months, the market disagrees with you.
Here is why it matters:
- It shows feature relevance. If a feature has a low adoption rate despite being promoted, it may not align with your users’ actual needs.
- It directly impacts retention. Users who adopt more features tend to stay longer. When users find value in your product, they are less likely to churn. This is especially true in SaaS, where user adoption is closely tied to monthly and annual retention.
- It justifies your product decisions. Adoption data helps you decide what to cut, what to improve, and what to double down on.
Feature Adoption Metrics You Should Track
Feature adoption rate is the key metric, but it works best when paired with other metrics.
Here are the ones that you need to watch.
- Engagement Rate: How often are users coming back to use the feature? A user who tries a feature once and never returns is very different from one who uses it daily.
- Activation Rate: The percentage of users who experience the core value of a feature. A high activation rate means your onboarding doesn’t suck and that users immediately understand why they should care.
- Time to First Use: How long does it take a new user to find and use the feature after signing up? A long time-to-first-use often means the feature is buried or the onboarding process does not surface it properly.
- Feature Usage Frequency: How often are active users engaging with the feature? This tells you whether adoption is sticky or shallow.
- Adoption Rate by Segment: Breaking down adoption by user segment, such as plan type, industry, or company size, reveals which users find the feature valuable and which do not. This is essential for targeting and personalization.
How to Measure Feature Adoption Rate
Now that you know the right metrics to track, here are the steps you can follow to track feature adoption:
Set Up Event Tracking
You need to know when a user interacts with each feature. This requires event tracking. An event is any meaningful action a user takes inside your product, such as clicking a button, completing a workflow, or saving a report.
List your top five to ten features by importance to your product’s core value.
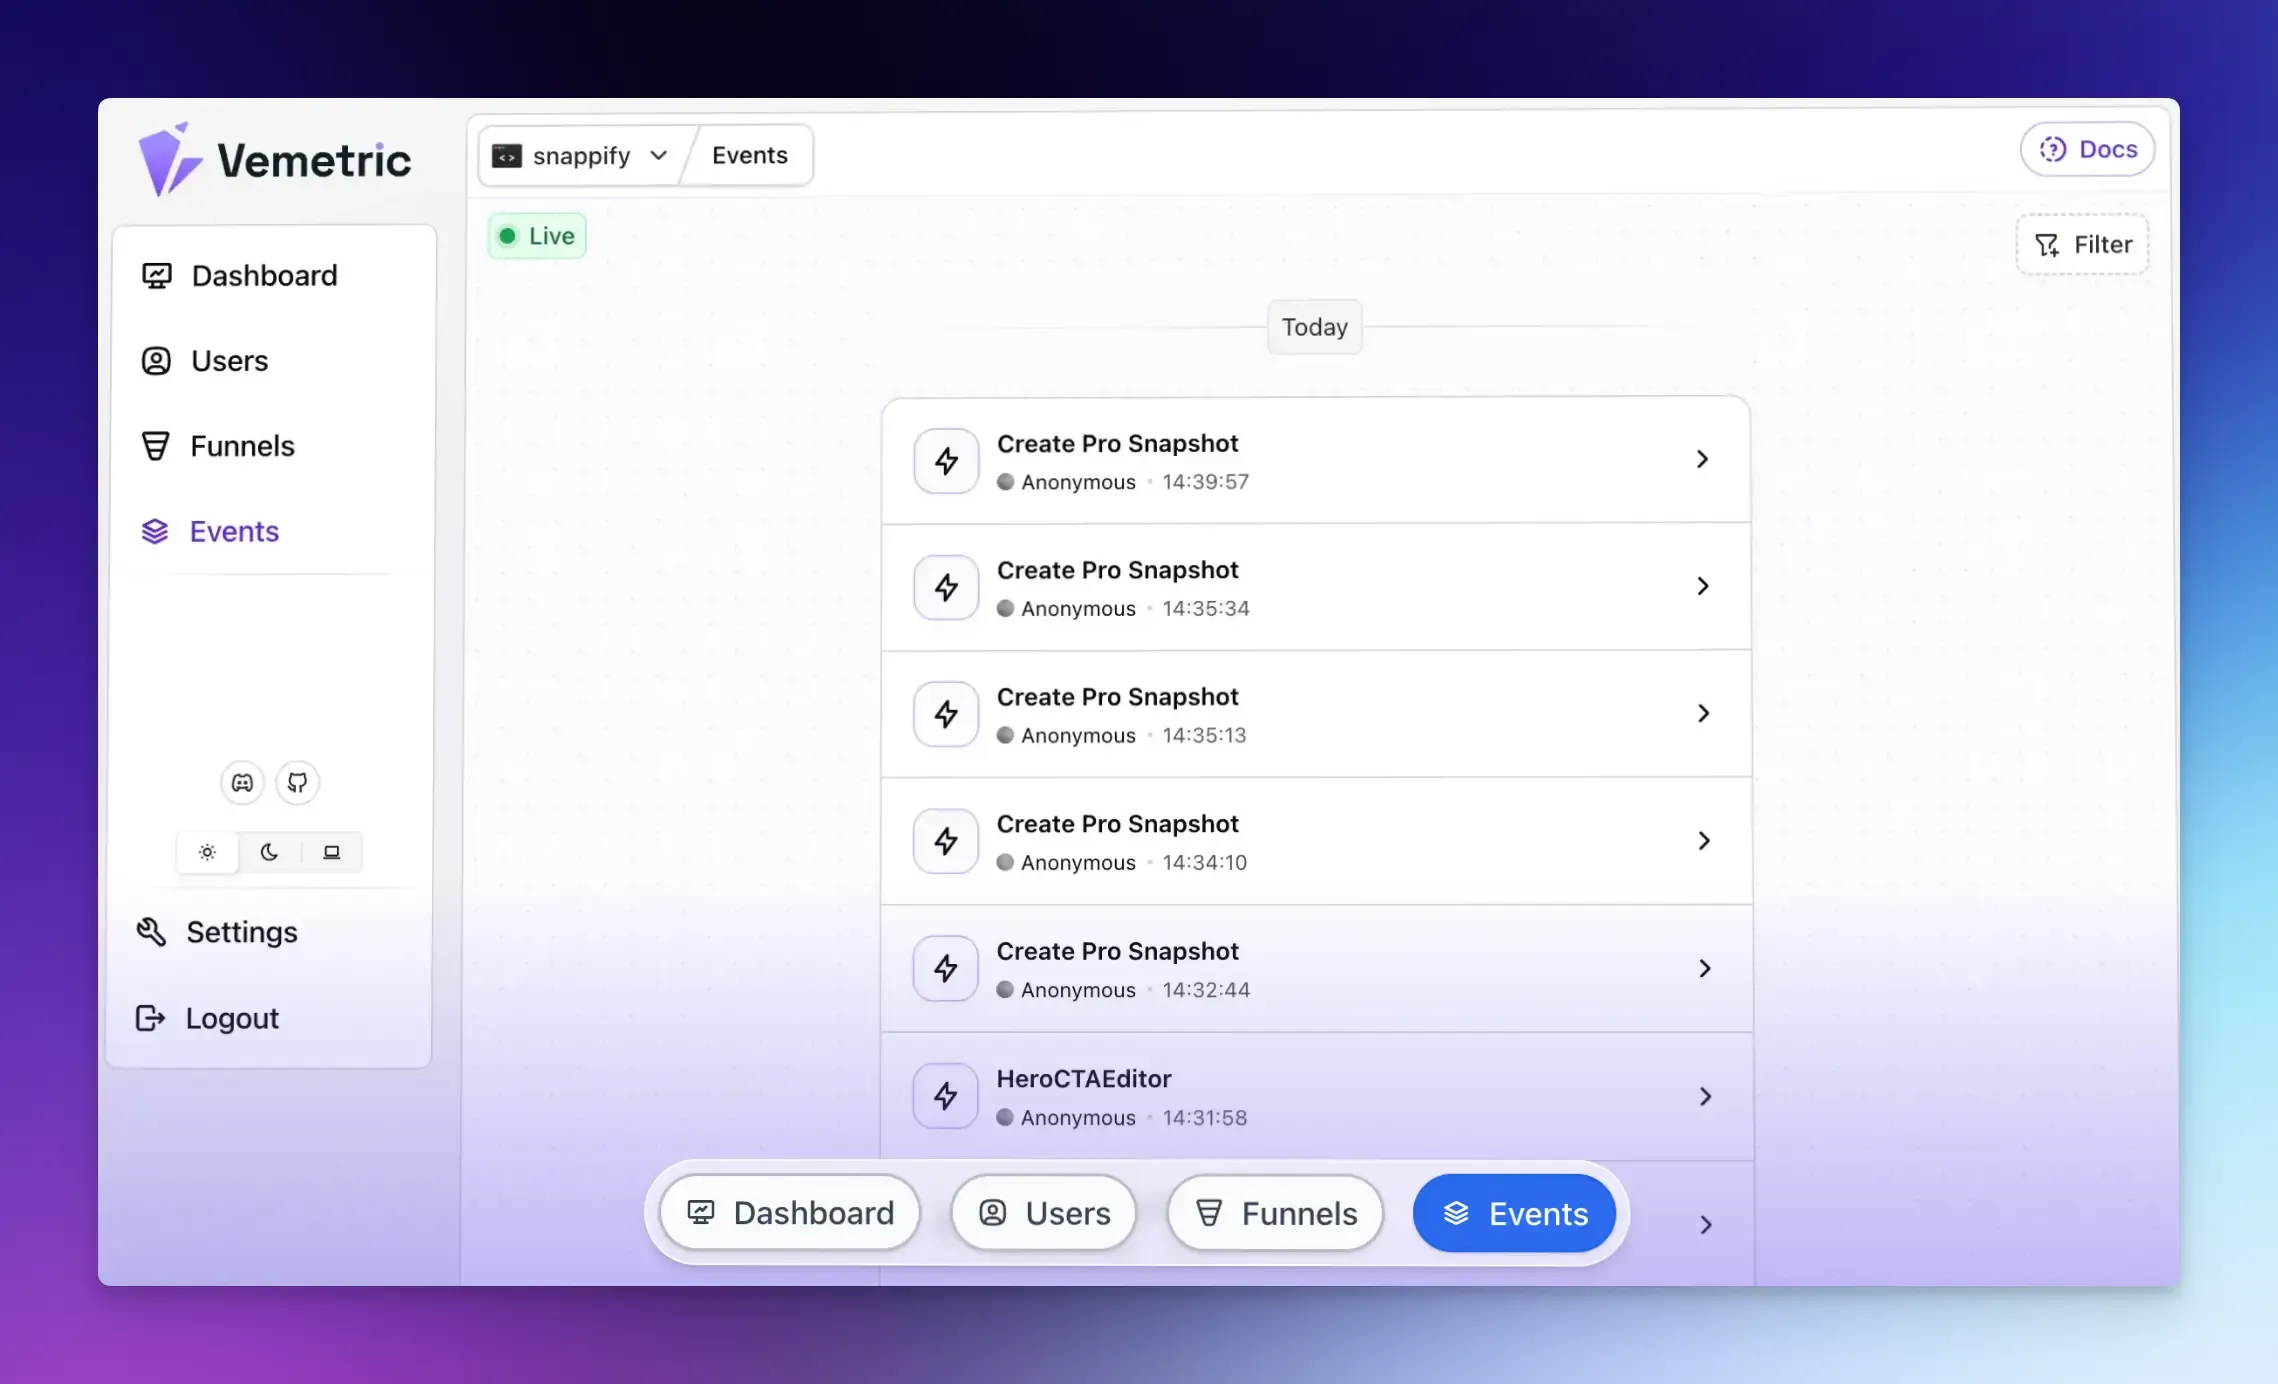
Then, use an event tracking tool like Vemetric to set up tracking for each of those features so you can measure who is using them and how often.
Build an Adoption Funnel
A single adoption rate indicates that something is wrong, but it doesn’t specify where. For that, you’ll need the adoption funnel, which is the journey a user takes from not knowing about a feature to using it regularly.
Identifying the drop-off point in this funnel will tell you exactly where you need to take action.
Think of the feature adoption funnel in five stages:
- Exposed: The user has become aware of the feature.
- Activated: The user has clicked on the feature at least once.
- Used: The user has completed the core action for which the feature is designed.
- Repeated: The user has used the feature more than once.
- Habitual: The feature is now part of the user’s daily workflow.
Most teams only track whether a user ever touched a feature. The adoption funnel shows you where users get stuck in this journey. That is where you should be spending your optimization efforts.
Use the Right Tool
You need a product analytics tool that captures events automatically and presents data clearly.
With Vemetric, you see the complete user journey from first visit to feature adoption. It gives you the data you need to understand, measure, and improve feature adoption without spending hours digging through reports.
- Track Feature Usage: Vemetric automatically tracks pageviews and outbound link clicks. You can define custom events for specific user actions, and measure how many users use each feature, how often, and in what context. You get feature adoption and user engagement metrics all in one place.
- Visualize Your Adoption Funnel: Vemetric’s funnel analysis shows you the exact drop-off points in your adoption journey. You can track how individual users interact with your product and optimize conversion funnels to improve retention.
- Segment Users By Behavior: Vemetric lets you filter user segments by their properties and behaviors. You can see segment-specific adoption patterns to personalize your messaging and product experience accordingly.
Ways to Improve Feature Adoption Rate
Improving adoption requires serious effort. Here’s how you can improve your feature adoption strategy.
Fix Your Onboarding Flow
Onboarding is the most underused tool for feature adoption. Most users form habits in their first few sessions. If your onboarding flow does not surface your key features early, you lose that window.
- Create dedicated onboarding steps that highlight specific features based on the user’s sign-up purpose.
- Use checklists, product tours, and contextual tooltips to walk users through their first experience.
- Use in-app messages that explain what the feature does for users.
Simplify the First Interaction
The first time a user touches a feature sets the tone for everything that follows. If that first experience is bad, they will not come back.
- Show the value within the first thirty seconds.
- Use interactive tutorials instead of walls of text.
- Let users try the feature before asking them to commit.
Follow Up with Inactive Users
If a user activated a feature but never returned, send a targeted follow-up. A short email or in-app message to reintroduce the feature and its benefits can bring users back.
The best way to do this is to segment and personalize. If you promote a feature to everyone, most users will ignore it because it does not feel relevant to them.
Use behavioral data to identify who would benefit most from each feature, then target those users specifically.
Segment your adoption data by plan type, user role, company size, signup date, and geography. This will help you identify patterns and see where to focus your efforts.
Final Words
Feature adoption rate is one of the biggest signals of whether your product is delivering real value to users.
You need the right numbers, a clear funnel, and a feature adoption strategy that helps you track the right data and meet all of your user’s needs. Only then can you build a product that they will find useful from day one.
Vemetric gives you the visibility you need to start proper measurement and track feature adoption without complexity.
FAQs
Monthly is good for most SaaS products. However, after a new feature is launched, you should track it weekly for the first four to six weeks.
Product adoption is the full journey a user takes from signing up to regularly deriving value from your product. Feature adoption focuses on one specific feature within that product. You can achieve strong product adoption while still having individual features that are barely used.
Tracking both gives you a complete view of how users are engaging at every level.
Daily active users tell you how many people use your product in a day. The feature adoption rate tells you how many of those users are using a specific feature. Both matter, but they answer different questions. You need feature adoption rate to understand what is actually happening inside your product, not just how often people show up.
Ready to understand your users?
Start tracking