Funnels
Track the conversion rate through a series of events, helping you understand where users drop off.
Funnels in Vemetric help you understand how users navigate through critical paths in your product, revealing where they succeed and where they drop off.
Whether you’re tracking onboarding flows, checkout processes, or feature adoption, funnels provide clear insights into conversion rates at each step.
Understanding Funnels
A funnel represents a series of steps that users should complete to achieve a goal. Each step can be a pageview or a custom event, and Vemetric tracks how many users progress from one step to the next.
For example, a typical e-commerce funnel might look like:
- User views product page
- User adds item to cart
- User proceeds to checkout
- User completes purchase
Vemetric calculates the conversion rate between each step, helping you to identify bottlenecks and optimize user experience.
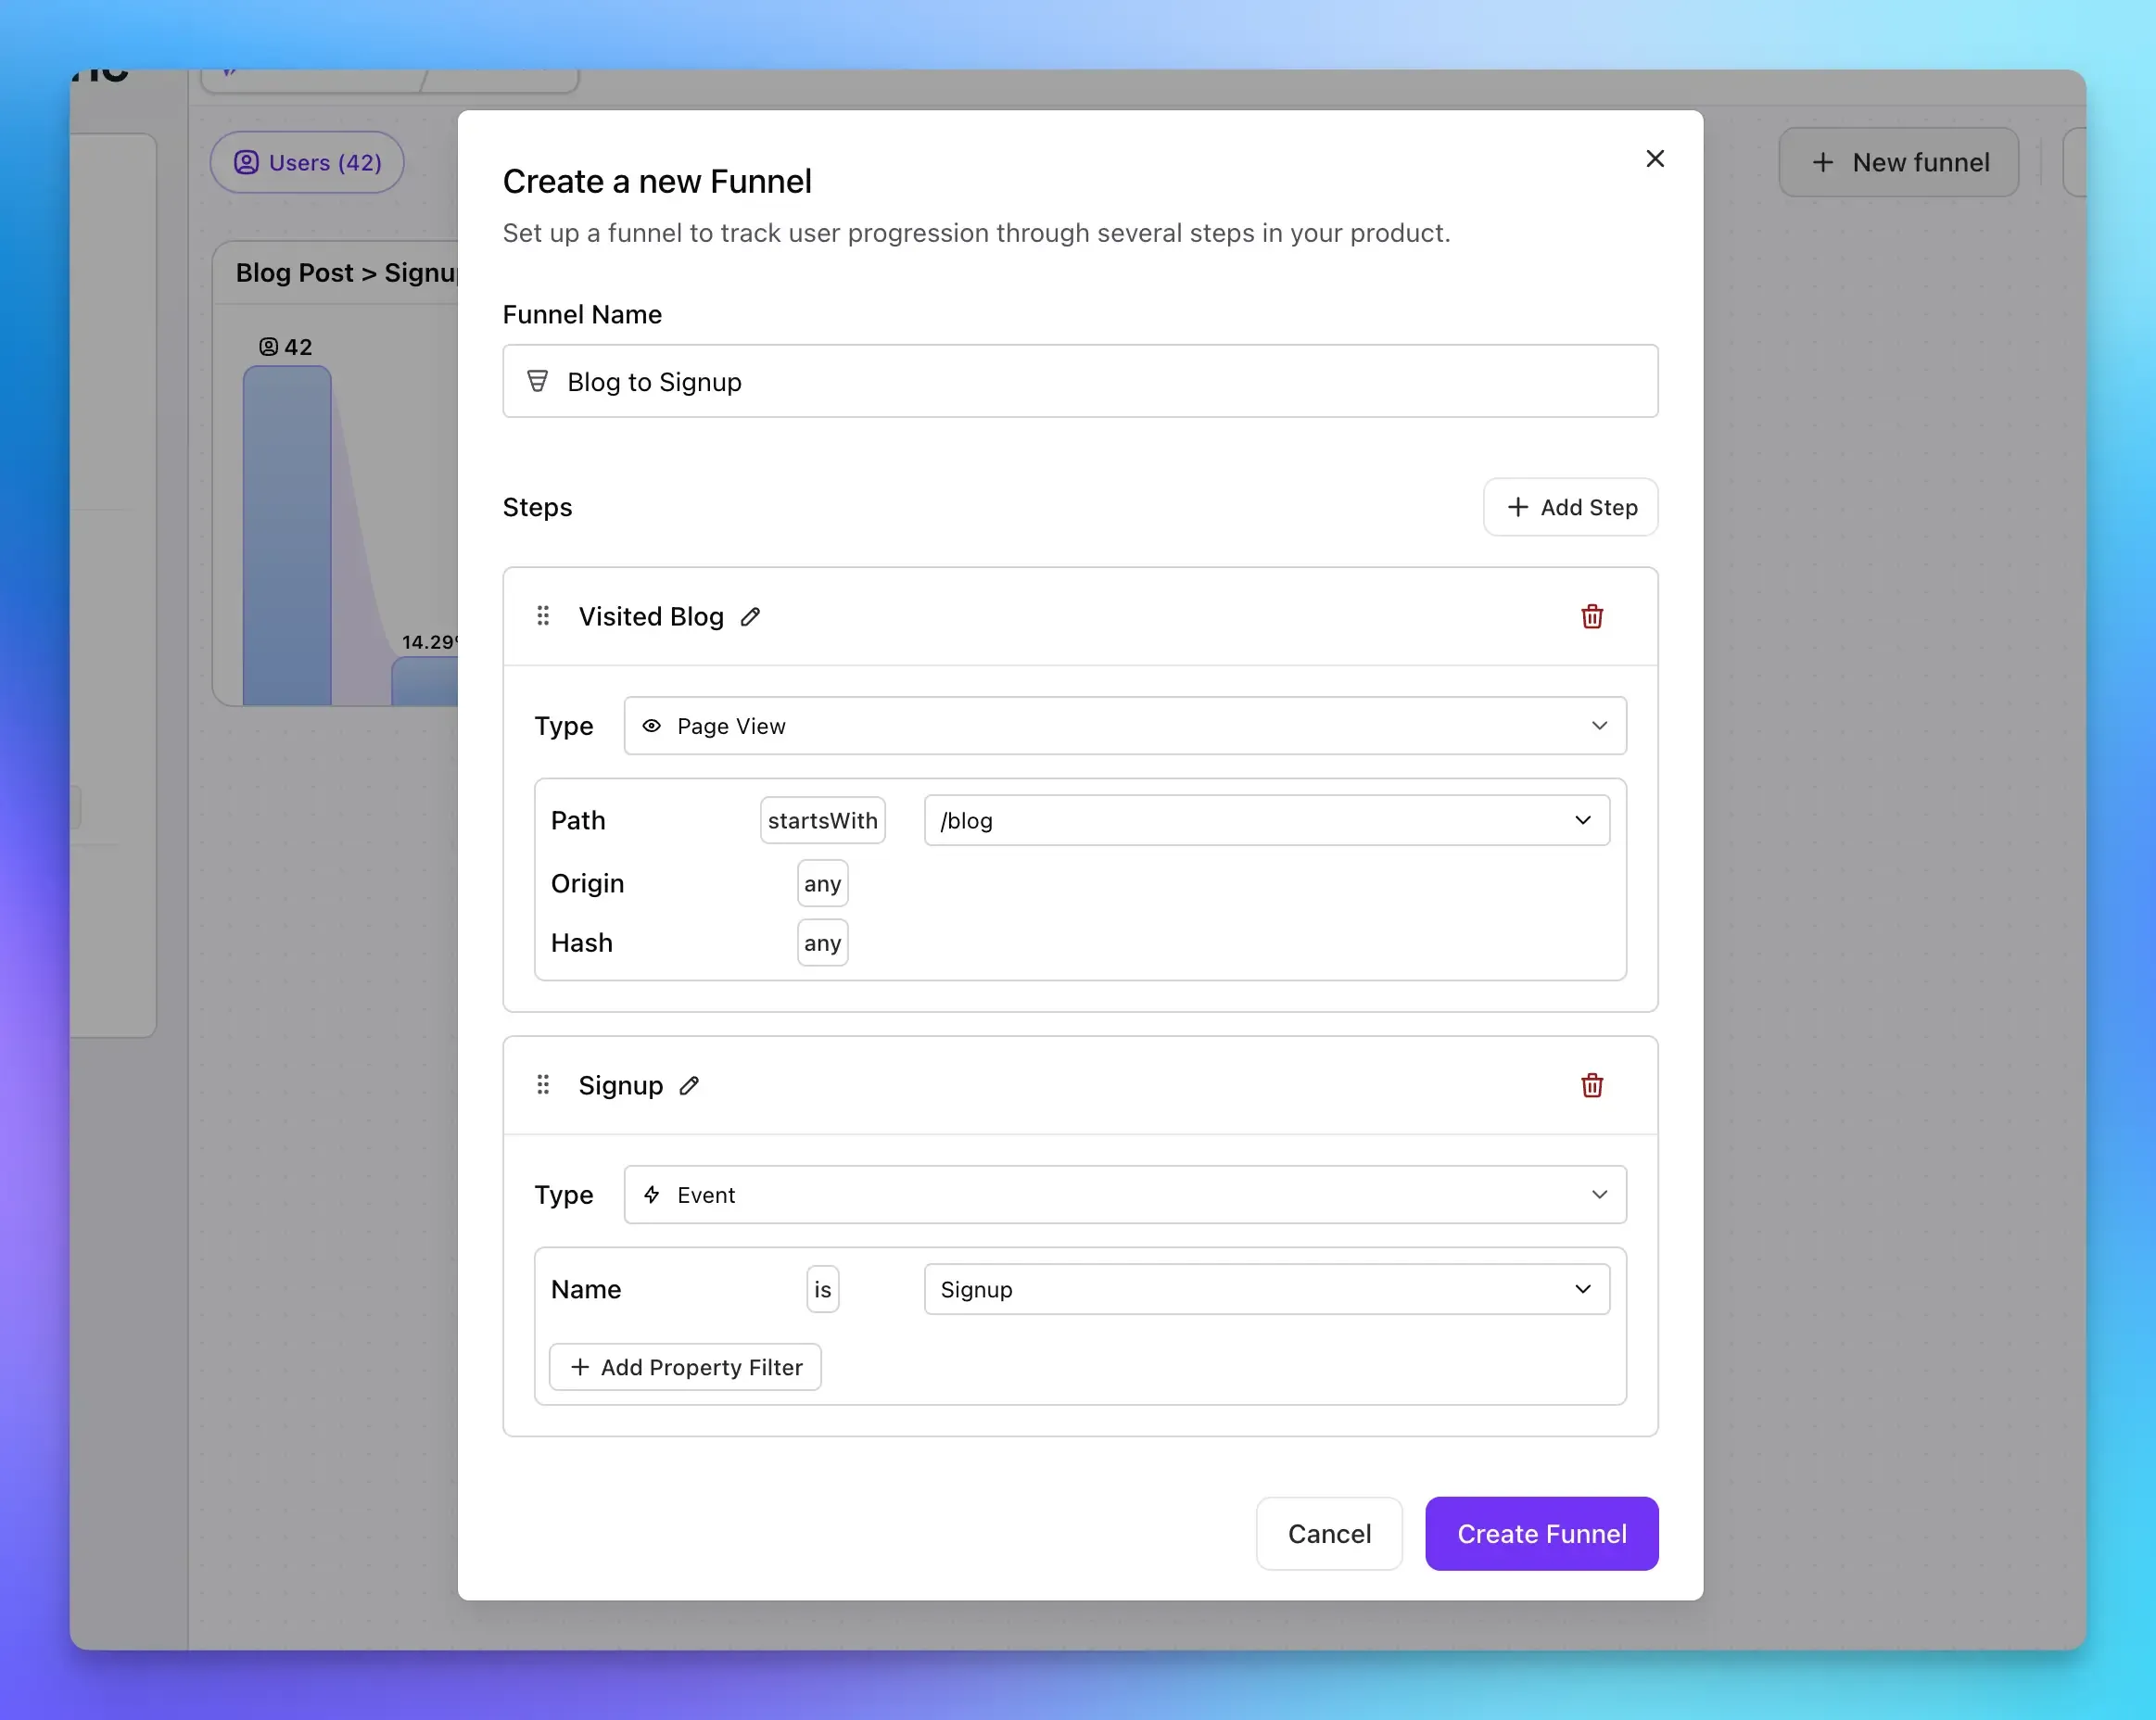
Creating Your First Funnel
To create a funnel, navigate to the “Funnels” page via your project’s sidebar and click on the New funnel button to get started.
Defining Funnel Steps
Each funnel can have up to 10 steps. For each step, you can choose between:
- Pageview: Track when users visit specific pages
- Custom Event: Track specific actions like button clicks, form submissions, or feature usage
Analyzing Funnel Performance
Once your funnel is created, Vemetric automatically calculates conversion metrics in real-time. The funnel analysis page provides multiple views to understand user behavior.
Visualization Modes
Vemetric offers two visualization modes for funnel data:
- Horizontal View: Displays steps side-by-side with visual flows between them, perfect for desktop analysis
- Vertical View: Stacks steps vertically, optimized for mobile devices and compact displays
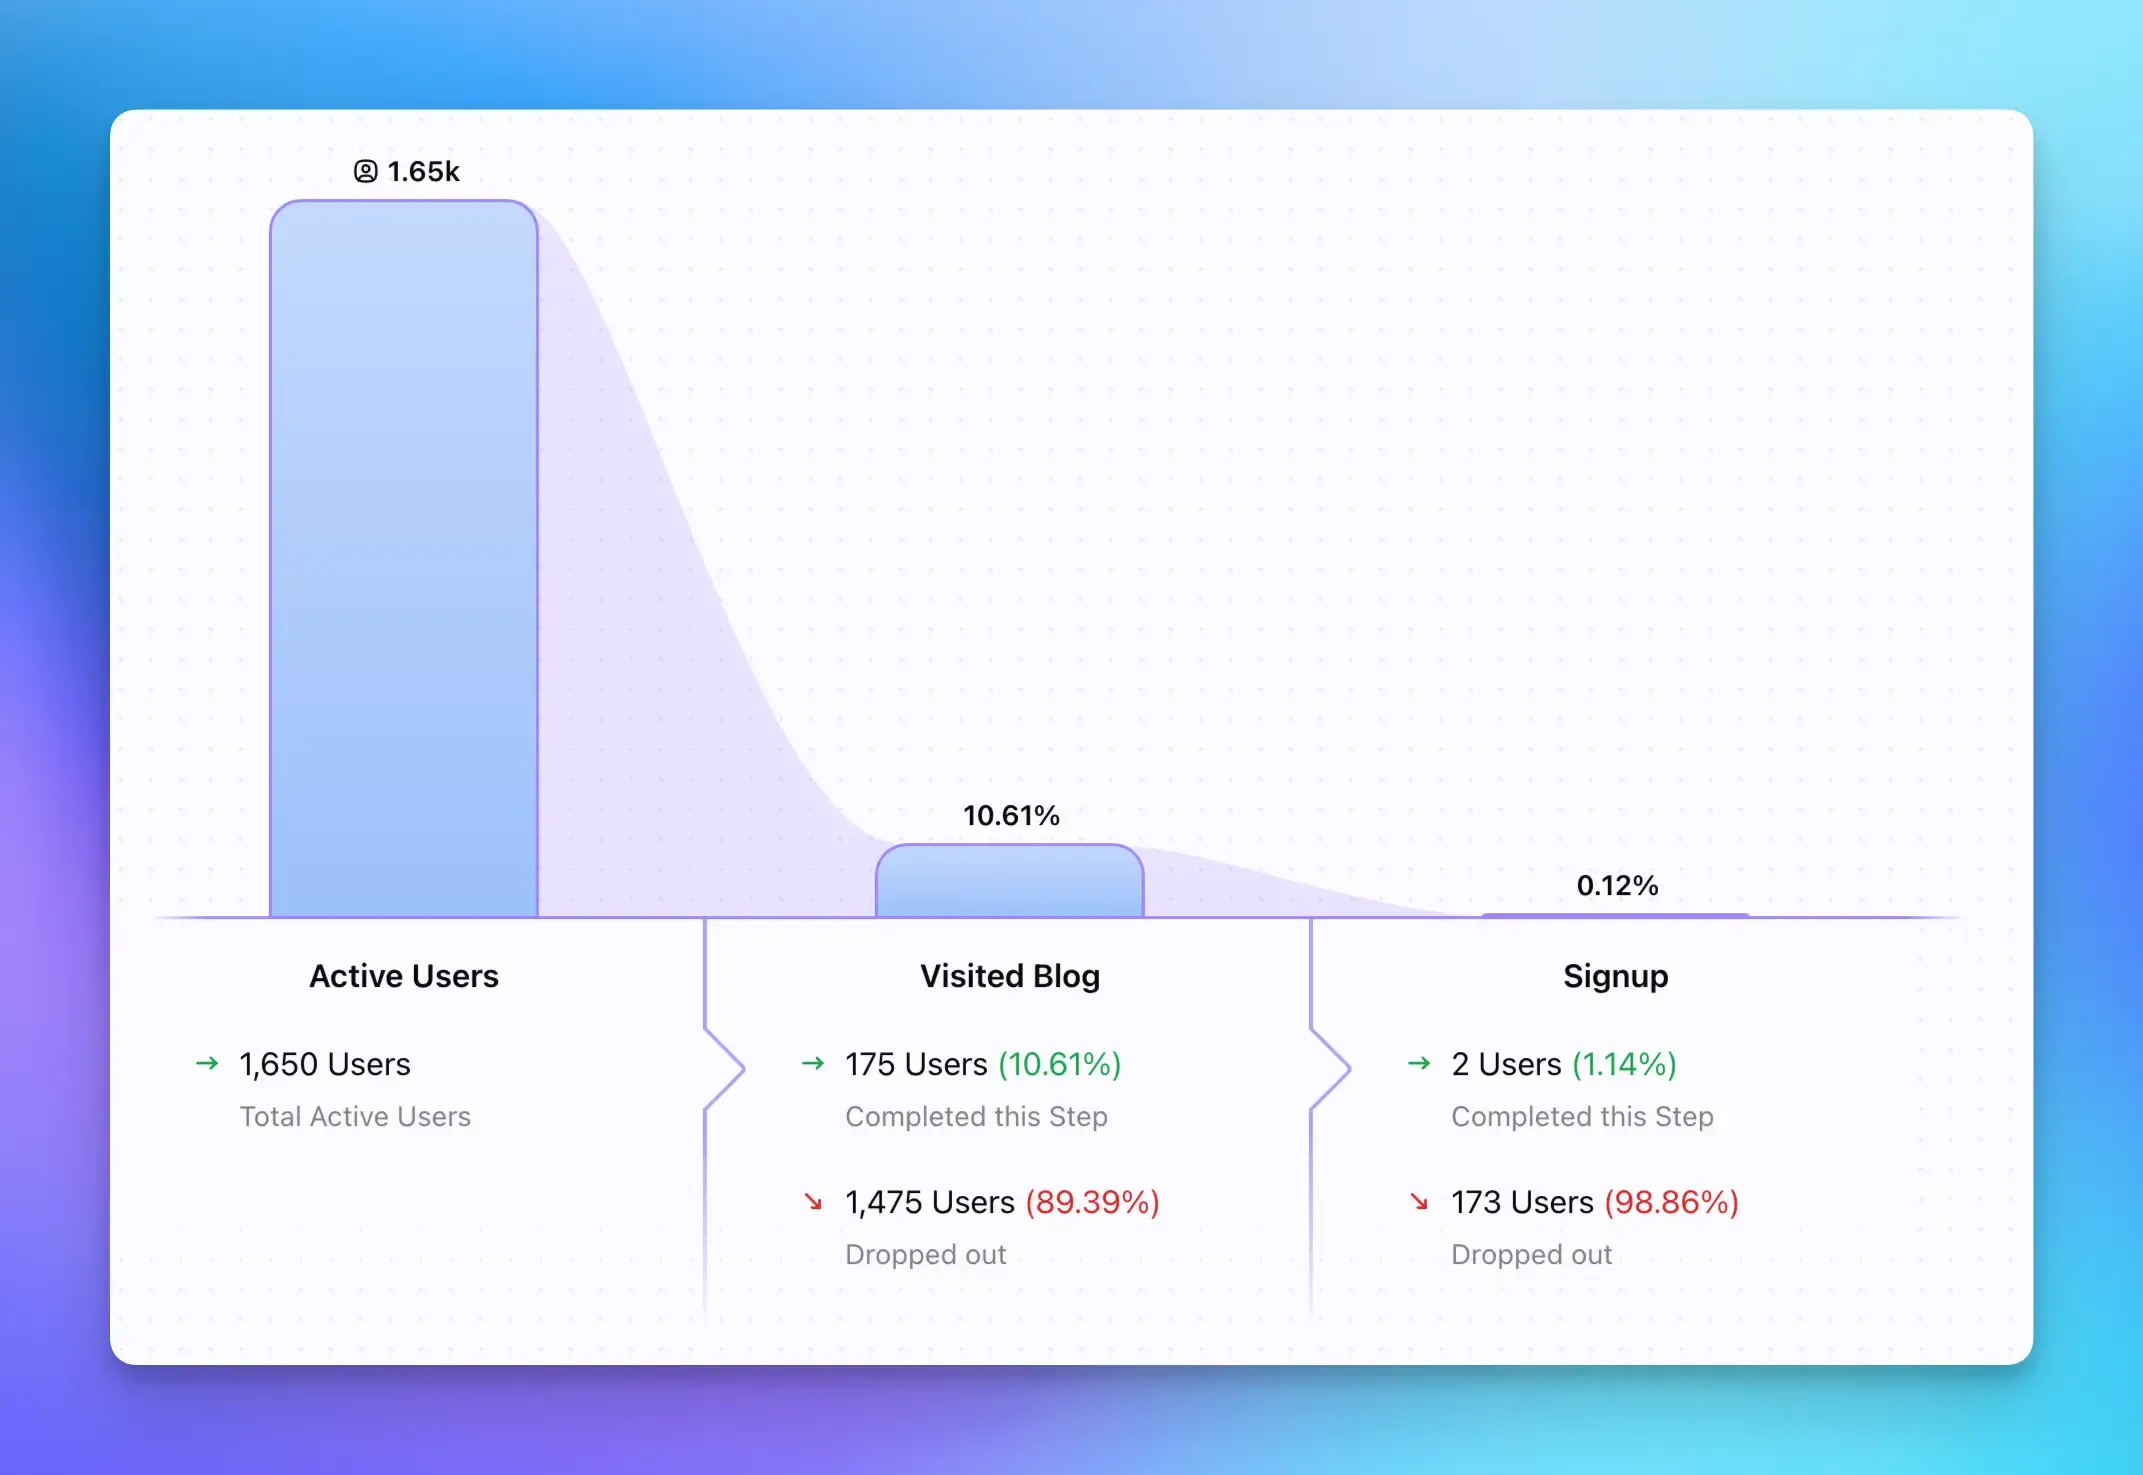
Key Metrics
For each funnel step, you’ll see:
- Absolute numbers: How many users reached this step
- Conversion rate: Percentage of users who progressed from the previous step
- Drop-off rate: Where users are leaving the funnel
- Overall conversion: End-to-end funnel completion rate
Active Users Toggle
By default, funnels show conversion rates based on users who entered the funnel. You can toggle to view performance relative to all active users in your selected time period, providing context about what percentage of your total user base completes the funnel.
Filters
There’s also the possibility to apply several filter criteria on the funnel pages, so you’re able to analyze how specific user groups convert differently.
You can reuse saved filters on funnel pages as well, which is useful when you repeatedly analyze the same segment.
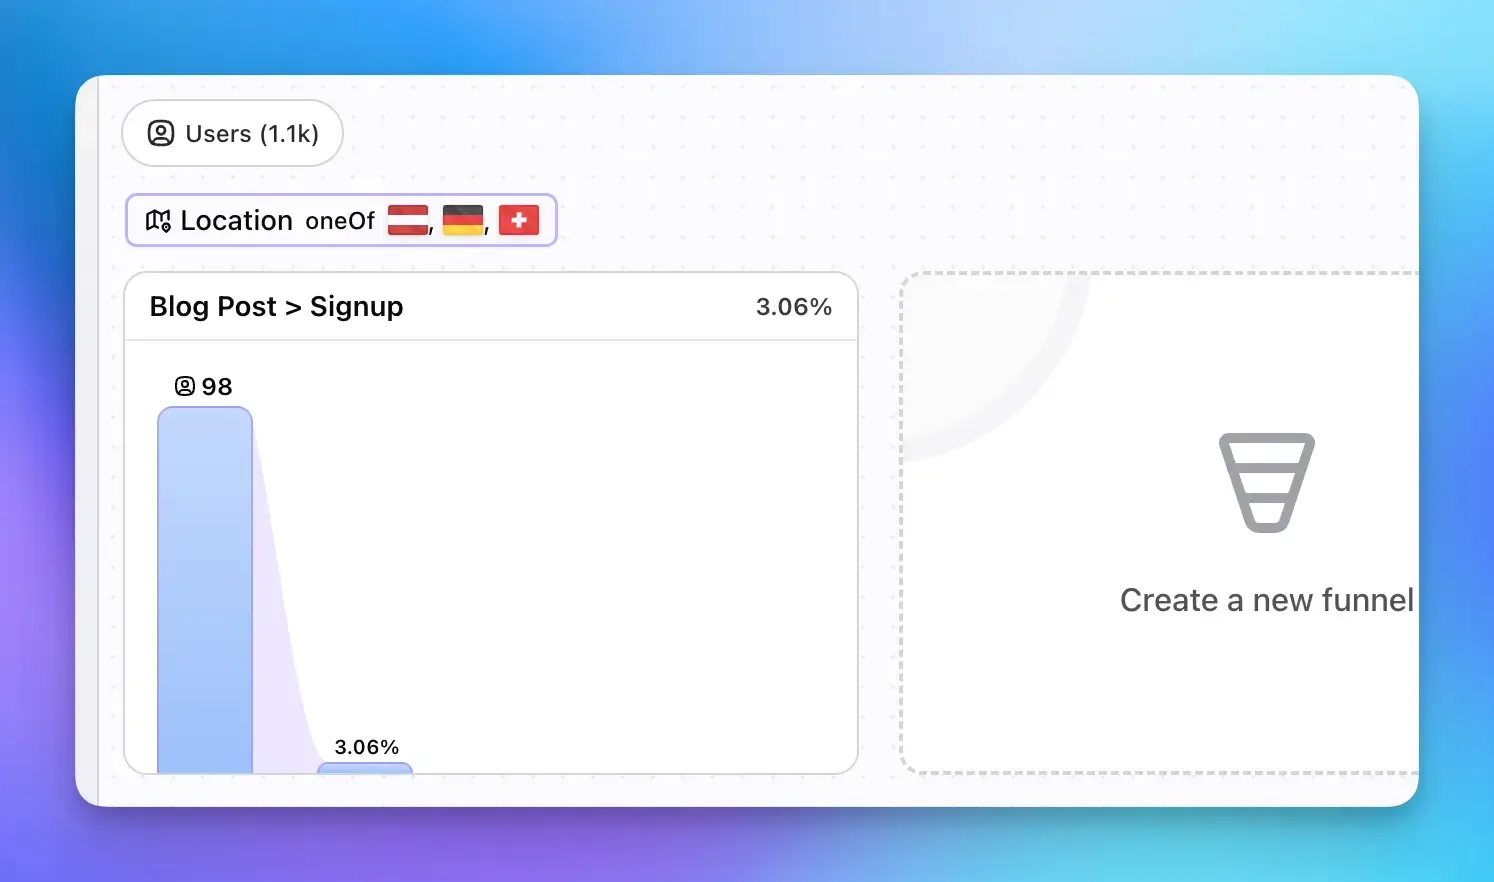
PS: on the Dashboard and on the Users page you’re able to filter for users that have completed a Funnel (or a Step of it).
Time Window
In Vemetric, Funnels have a fixed time window of 7 days to track user progression. This means users have 7 days to complete all funnel steps for their journey to count as a conversion.
The time window ensures you’re measuring meaningful conversions while accounting for users who might not complete all steps in a single session.
We consider making this time window configurable. Please reach out if you’re in need for that.
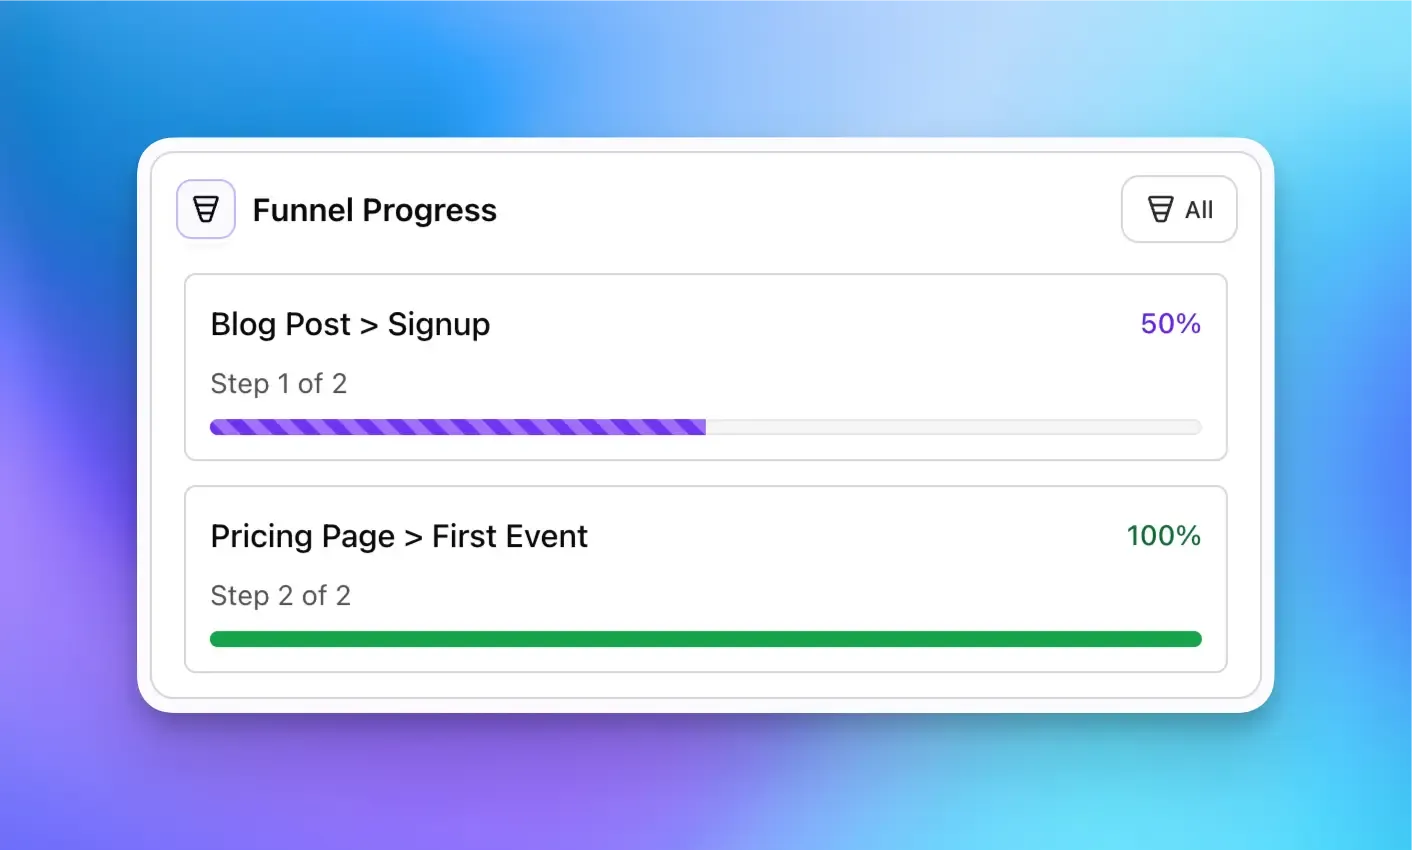
Funnel Progress of a specific User
When you view a specific user, you’re also able to see the progress he has made across all the Funnels you’ve created in your project.
Next Steps
Now that you understand funnels, you can:
- Create your first funnel to track a critical user flow
- Combine funnels with User Journeys for deeper behavioral insights
- Use funnel insights to prioritize product improvements
Funnels are a powerful tool for understanding user behavior and optimizing conversion rates. Start with your most important user flows and expand your analysis as you gain insights.
Visualize and analyze the full journey of users across your product with Vemetric.
Learn how to track users seamlessly across multiple subdomains with Vemetric.