Picture two SaaS companies that each closed the year with $10 million in ARR and didn’t sign a single new customer in the twelve months that followed.
Company A ends the year at $11.5 million. Company B ends the year at $8.7 million. Nothing about their sales teams explains that $2.8 million gap, because neither company added one. The difference comes entirely from what happened inside their existing customer base: upgrades, downgrades, and cancellations.
That difference has a name: net revenue retention (NRR).
It’s the number that tells you whether your current customers are quietly growing your revenue or quietly draining it, and in 2026 it’s the single metric boards, investors, and acquirers scrutinize before almost anything else.
This guide covers what NRR actually measures, the exact formula, current benchmarks by segment, and the part most articles skip: how product usage data turns NRR from a lagging finance report into something you can actively manage and improve.
What is Net Revenue Retention (NRR)?
Net revenue retention, sometimes called net dollar retention (NDR), measures how much recurring revenue survives and expands within one specific group, or cohort, of customers over time.
It captures four things happening inside that customer base:
- Expansion revenue: upsells, seat additions, usage growth, add-on purchases
- Contraction: downgrades to a cheaper plan or reduced usage
- Churn: customers who cancel entirely
- Starting revenue: what that cohort was paying at the beginning of the period
What it deliberately leaves out: any revenue from customers who joined after the period started.
That’s what makes NRR different from total revenue growth.
It isolates one question: are the customers you already have becoming more or less valuable over time?
- NRR above 100% means expansion revenue outpaces contraction and churn combined. Your existing base is growing without any new logos.
- NRR at exactly 100% means you’re treading water. Expansion is covering losses, but nothing more.
- NRR below 100% means your existing base is shrinking, and new customer acquisition has to work overtime to keep total revenue flat.
The Net Revenue Retention Formula
The standard net revenue retention formula is:
NRR = (Starting ARR + Expansion − Contraction − Churn) ÷ Starting ARR × 100
Keep the same revenue unit throughout, either MRR or ARR, and never mix the two in one calculation.
Example
Say your cohort started the period with $1,000,000 in ARR. Over the next 12 months:
- Expansion revenue (upsells, cross-sells, seat growth): +$180,000
- Contraction (downgrades): −$50,000
- Churned revenue (cancellations): −$80,000
Ending ARR from that same cohort = $1,000,000 + $180,000 − $50,000 − $80,000 = $1,050,000
NRR = $1,050,000 ÷ $1,000,000 × 100 = 105%
That business grew 5% from existing customers alone, with zero new sales activity.
Cohort method vs. formula method
Most finance teams calculate NRR using the cohort method: pull the exact group of customers active at the start of the period, then track only that group’s revenue at the end.
It’s the most accurate approach and the one investors expect to see.
A simplified formula method (comparing total existing-customer revenue period over period) is faster but can be distorted by mid-period upgrades and downgrades at high-velocity, lower-ACV companies.
If you’re running a proper cohort analysis already for retention tracking, you can pull the same cohorts for NRR.
NRR vs. Churn Rate: What’s the Difference?
Churn rate and NRR are related but answer different questions, and mixing them up leads to bad decisions.
- Churn rate measures how many customers (logo churn) or how much revenue (revenue churn) you lost. It’s a single input.
- NRR is a compound metric. It combines churn, contraction, and expansion into one number that reflects the net direction of your existing base.
A few things worth knowing:
- A company can have low logo churn and still have concerning NRR if its largest accounts are downgrading.
- A company can have relatively high churn among small accounts and still post a strong NRR if expansion from mid-market and enterprise accounts more than offsets it.
- Churn rate alone can’t tell you if you’re growing or shrinking. NRR can.
If your churn number looks fine but NRR is soft, the fix usually isn’t customer support; it’s expansion.
If you want the churn side of this equation covered in depth, including how behavioral data flags at-risk accounts before they cancel, see this guide to SaaS churn analytics and this one on reducing SaaS churn with product analytics.
What’s a Good Net Revenue Retention Rate? SaaS Benchmarks
There’s no single “good” NRR number. The right benchmark depends heavily on your average contract value (ACV) and customer segment, and treating a blended industry median as your target is one of the most common benchmarking mistakes teams make.
According to SaaS Capital’s survey of more than 1,000 private B2B SaaS companies, bootstrapped companies with $3 million to $20 million in ARR post a median NRR of 103%, with the 90th percentile reaching 117.9%. Median GRR for the same group sits at 91%.
The pattern holds everywhere you look: higher ACV correlates with higher NRR, because enterprise accounts go through a longer sales and implementation process, get dedicated support, and have far more room to expand through additional seats or usage.
If you’re an SMB-focused product, chasing a 120% NRR target built for enterprise SaaS is chasing the wrong number. Benchmark against your own ACV tier, not the industry-wide median.
How to Increase Net Revenue Retention: A Practical Playbook
Improving NRR isn’t one initiative; it’s a handful of connected moves, most of which start with data you’re probably not looking at yet.
- Fix activation before you fix expansion: An account that never reaches value in the first weeks won’t expand, no matter how good your upsell email is. Start by closing the gap between signup and first real outcome.
- Build usage-based upgrade triggers into the product itself: Prompt customers when they approach a plan limit, instead of letting them find out the hard way. This turns a natural growth moment into a self-serve upgrade instead of a support escalation.
- Give customer success teams real usage data, not renewal-date reminders: CS teams managing expansion and renewal need to know which accounts are using core features heavily and which have gone quiet weeks before the renewal conversation, not the day of it.
- Segment accounts by usage health, not just plan tier: Two customers paying the same amount can be in completely different places: one expanding fast, one about to churn. Usage segmentation catches that difference early.
- Price and package around your actual value metric: If usage-based or seat-based pricing reflects how customers get value, expansion becomes a natural byproduct of the customer succeeding, not a separate sales motion.
- Catch contraction risk with behavioral early-warning signals. Falling engagement, unused seats, or abandoned key workflows all show up in usage data well before a downgrade request lands in your inbox. This is the same behavioral approach covered in this guide to SaaS churn analytics.
- Track NRR by cohort, monthly, even if you report it quarterly: Metrics move slowly, so waiting a full quarter to check in means you’re always reacting a quarter late.
For teams building this out inside a broader growth framework, NRR sits squarely in the “Revenue” stage of the AARRR pirate metrics framework, and improving it usually means revisiting the Activation and Retention stages that feed into it.
How Vemetric Helps You Track the Signals Behind NRR
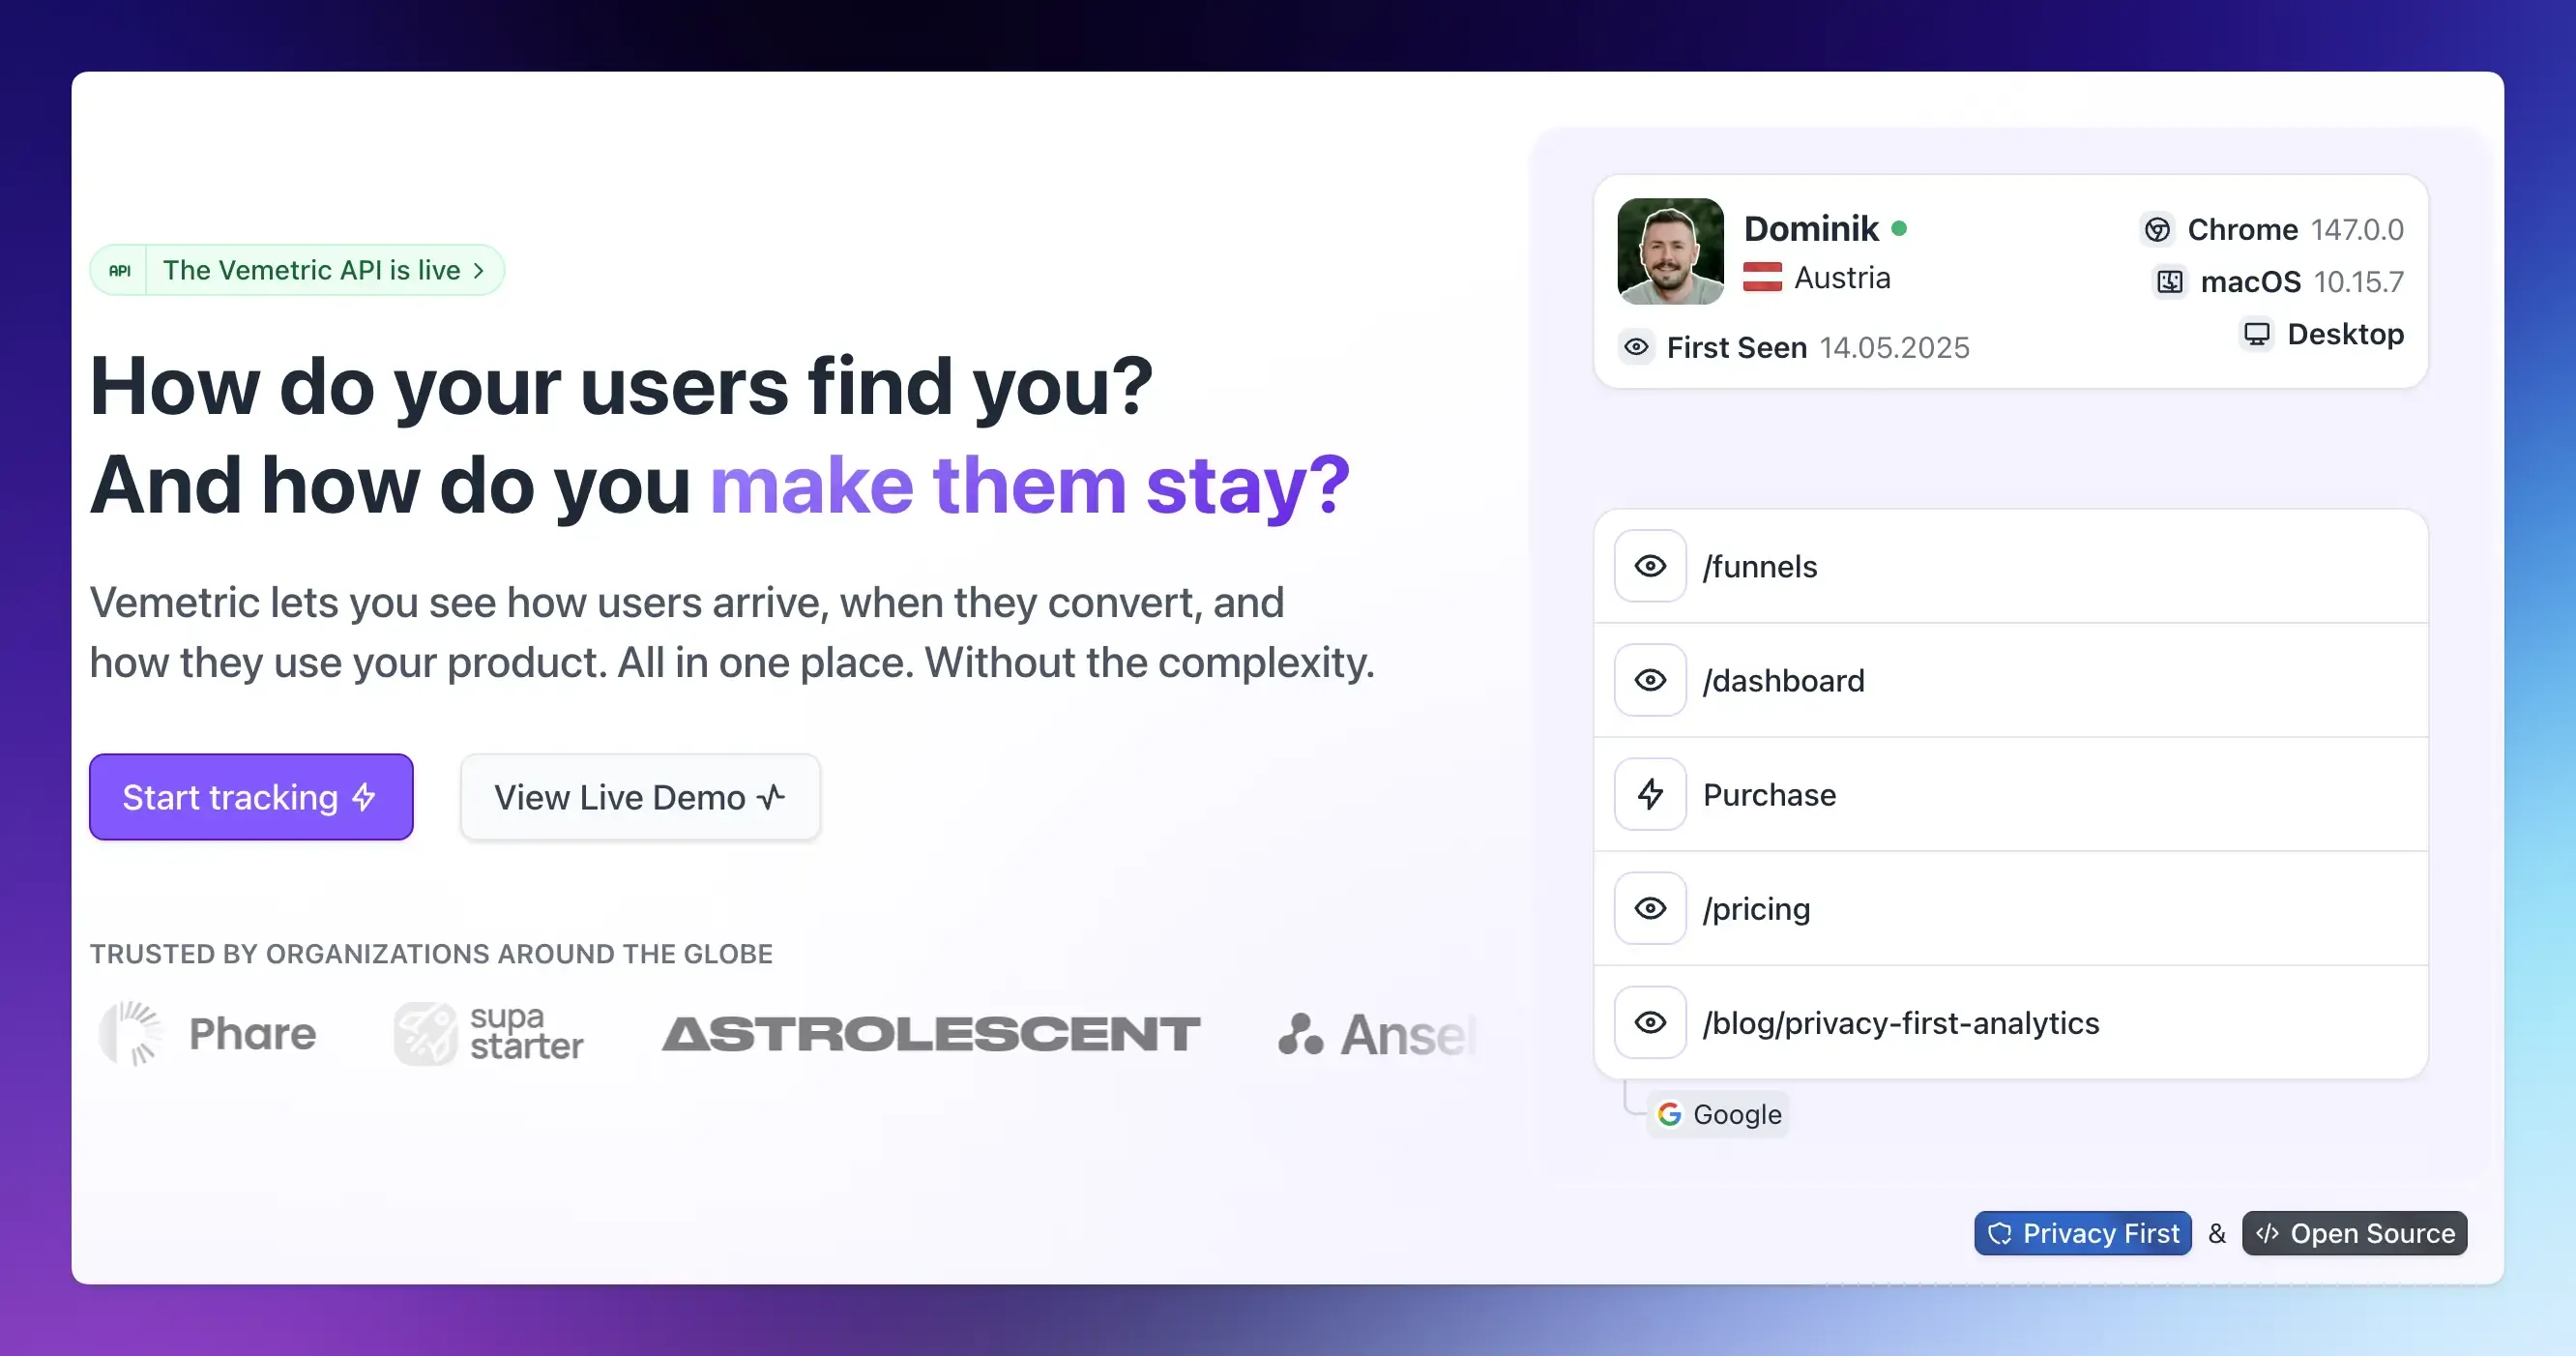
NRR itself is a finance calculation, but every input into it (activation, feature adoption, engagement, and the early signs of contraction) lives inside your product. That’s the layer Vemetric is built to show you.
With Vemetric, you can:
- See individual user journeys to understand exactly how your best (and most expansion-prone) accounts use your product.
- Track feature adoption and usage thresholds that signal an account is ready to upgrade
- Monitor funnels to see where in-app upgrade paths succeed or stall
- Watch event streams in real time to catch disengagement before it turns into a downgrade or cancellation.
- Do it all without cookies by default, so your product and marketing analytics live in one privacy-first, GDPR-compliant tool instead of three disconnected ones.
If NRR has been a number you only see once a quarter in a spreadsheet, connecting it to real-time product usage data is the fastest way to start moving it.
FAQs
Quarterly for board reporting, but monthly on a rolling cohort basis internally. NRR moves slowly, so monthly tracking catches a downward trend before it’s three months old.
GRR excludes expansion and caps at 100%. NRR includes expansion and can exceed 100%. GRR is the retention floor; NRR is the growth ceiling.