Most SaaS products do not lose users because the product is weak. They lose users because people sign up, look around, never reach the point where the product helps them, and quietly leave. Analytics is how you see that happening and stop it.
What is time-to-value (TTV) in SaaS?
Time-to-value (TTV) is the elapsed time from when a user signs up to when they experience the first real outcome your product was built to deliver.
It is measured from signup to a validated value milestone, not to the end of an onboarding checklist.
A user can complete every setup step and still have no idea why your product matters, which is why “onboarding complete” is a false signal.
Four related terms are easy to confuse, so here is a clean comparison.
- Time-to-value (TTV): Signup to first real value. User sees their first live chart with their own data
- Time-to-first-value (TTFV): Signup to the first instance of a validated activation event. The activation event fires for the first time
- Activation rate: Percentage of new users who reach the value milestone. 40 of 100 signups hit the value event
- Onboarding completion: Whether a user finished a checklist or tour. Checklist shows 5 of 5 done (says nothing about value)
The takeaway: TTV and activation track real outcomes, while onboarding completion tracks busywork. Optimizing the wrong one is why many teams iterate on onboarding for a quarter and see activation stay flat.
How do you use analytics to reduce TTV and boost activation?
You reduce TTV by instrumenting the path to value, finding the exact step where users stall, and removing it. This is the practical workflow, and each step maps to a specific analytics view.
Step 1: Define your real first-value event

Your first-value event is the single action, ideally in the first session, that best separates users who retain from users who churn. Pick the outcome, not the vanity metric.
Examples of real value events:
- Project tool: user creates a project and adds a second person to it.
- Analytics tool: user sees a live chart with their own data.
- Invoicing tool: user sends a first real invoice.
Compare that to weak events like “completed profile” or “watched the intro video,” which feel like progress but predict nothing.
The validation test is simple: if users who reach the event do not retain noticeably better than users who do not, it is the wrong event. Confirm it with cohort data before you build anything around it.
Step 2: Measure your current TTV and activation baseline

You cannot improve a number you have never recorded, so start by baselining TTV and activation. Set up event tracking to capture three things:
- When each user signs up (the clock starts).
- When each user fires your first-value event (the clock stops).
- The gap between the two (your TTV) and the share who ever reach it (your activation rate).
Segment the baseline by signup source, plan, and persona. A tool like Vemetric gives you a real median TTV and activation number instead of a guess, which becomes the baseline against which every future change is measured.
Step 3: Build an activation funnel to find the drop-off

An activation funnel maps every step between signup and value, so you can see exactly where users fall out.
A typical funnel:
- Signed up
- Completed account setup
- Connected a data source or imported data
- Performed the core action once
- Reached the first-value event
Now find the biggest fall. If 70% of users drop between steps 3 and 4, that is your bottleneck, no guessing required.
Filter the funnel by segment too, because self-serve users and enterprise trials often stall at completely different steps.
Funnels turn a vague “activation problem” into one specific, fixable step.
Step 4: Watch real user journeys to see the friction

Funnels tell you where users drop; user journeys tell you why. A user journey is the full ordered path a person takes through your product, every page and event, grouped by session.
Open the journey of a stalled user, and the reason is often obvious:
- They bounced between two pages, hunting for something.
- They hit a setup screen and never returned.
- They tried the core action, got an error, and left.
Reviewing a handful of delayed journeys reveals patterns no aggregate number can.
An activity heatmap adds a layer by showing when users are active, so you can tell a real drop-off from someone who logged off for the night.
Step 5: Cut the steps between signup and value

Reducing TTV almost always means removing friction, not adding more onboarding. The highest-impact moves:
- Delete steps that do not lead to value: Three-field signup forms convert better than long ones. Every extra field is a place to lose someone.
- Personalize the path: Route different personas to different first-value events. A designer and a developer should not get identical onboarding.
- Kill setup friction: If value depends on importing data, offer templates, sample data, or a “try with demo data” path so users feel value before the heavy lifting.
- Front-load the win: Show the payoff in the first session. Products where users hit value in the first minutes convert far better.
Step 6: Track events in real time and iterate on cohorts

TTV work is a loop, not a one-time project, so verify every change against live data.
After each fix, watch a real-time event stream to confirm the new flow fires the events you expect, then compare cohorts:
- Did the median TTV drop for users who signed up after the change?
- Did that cohort’s activation rate move?
- Did the drop-off shift to a new step you now need to fix?
Real-time monitoring matters because many “activation problems” are actually broken tracking. Ship, watch the stream, verify, measure the cohort, repeat.
Which metrics should you track to reduce TTV?
Track five metrics consistently rather than forty dashboards nobody reads.
- Time-to-value (TTV): Sign up for the first value. Your headline speed metric.
- Time-to-first-value (TTFV): The tighter, event-based version for precision.
- Activation rate: Share of new users who reach the value event. Your headline volume metric.
- Time to first action: Delay between signup and any meaningful interaction. Long delays signal early confusion.
- Core feature adoption: Whether activated users adopt the features that drive retention and expansion.
Watch each by segment, follow the trend, and let the funnel point you to the next fix.
How Vemetric helps you reduce time-to-value
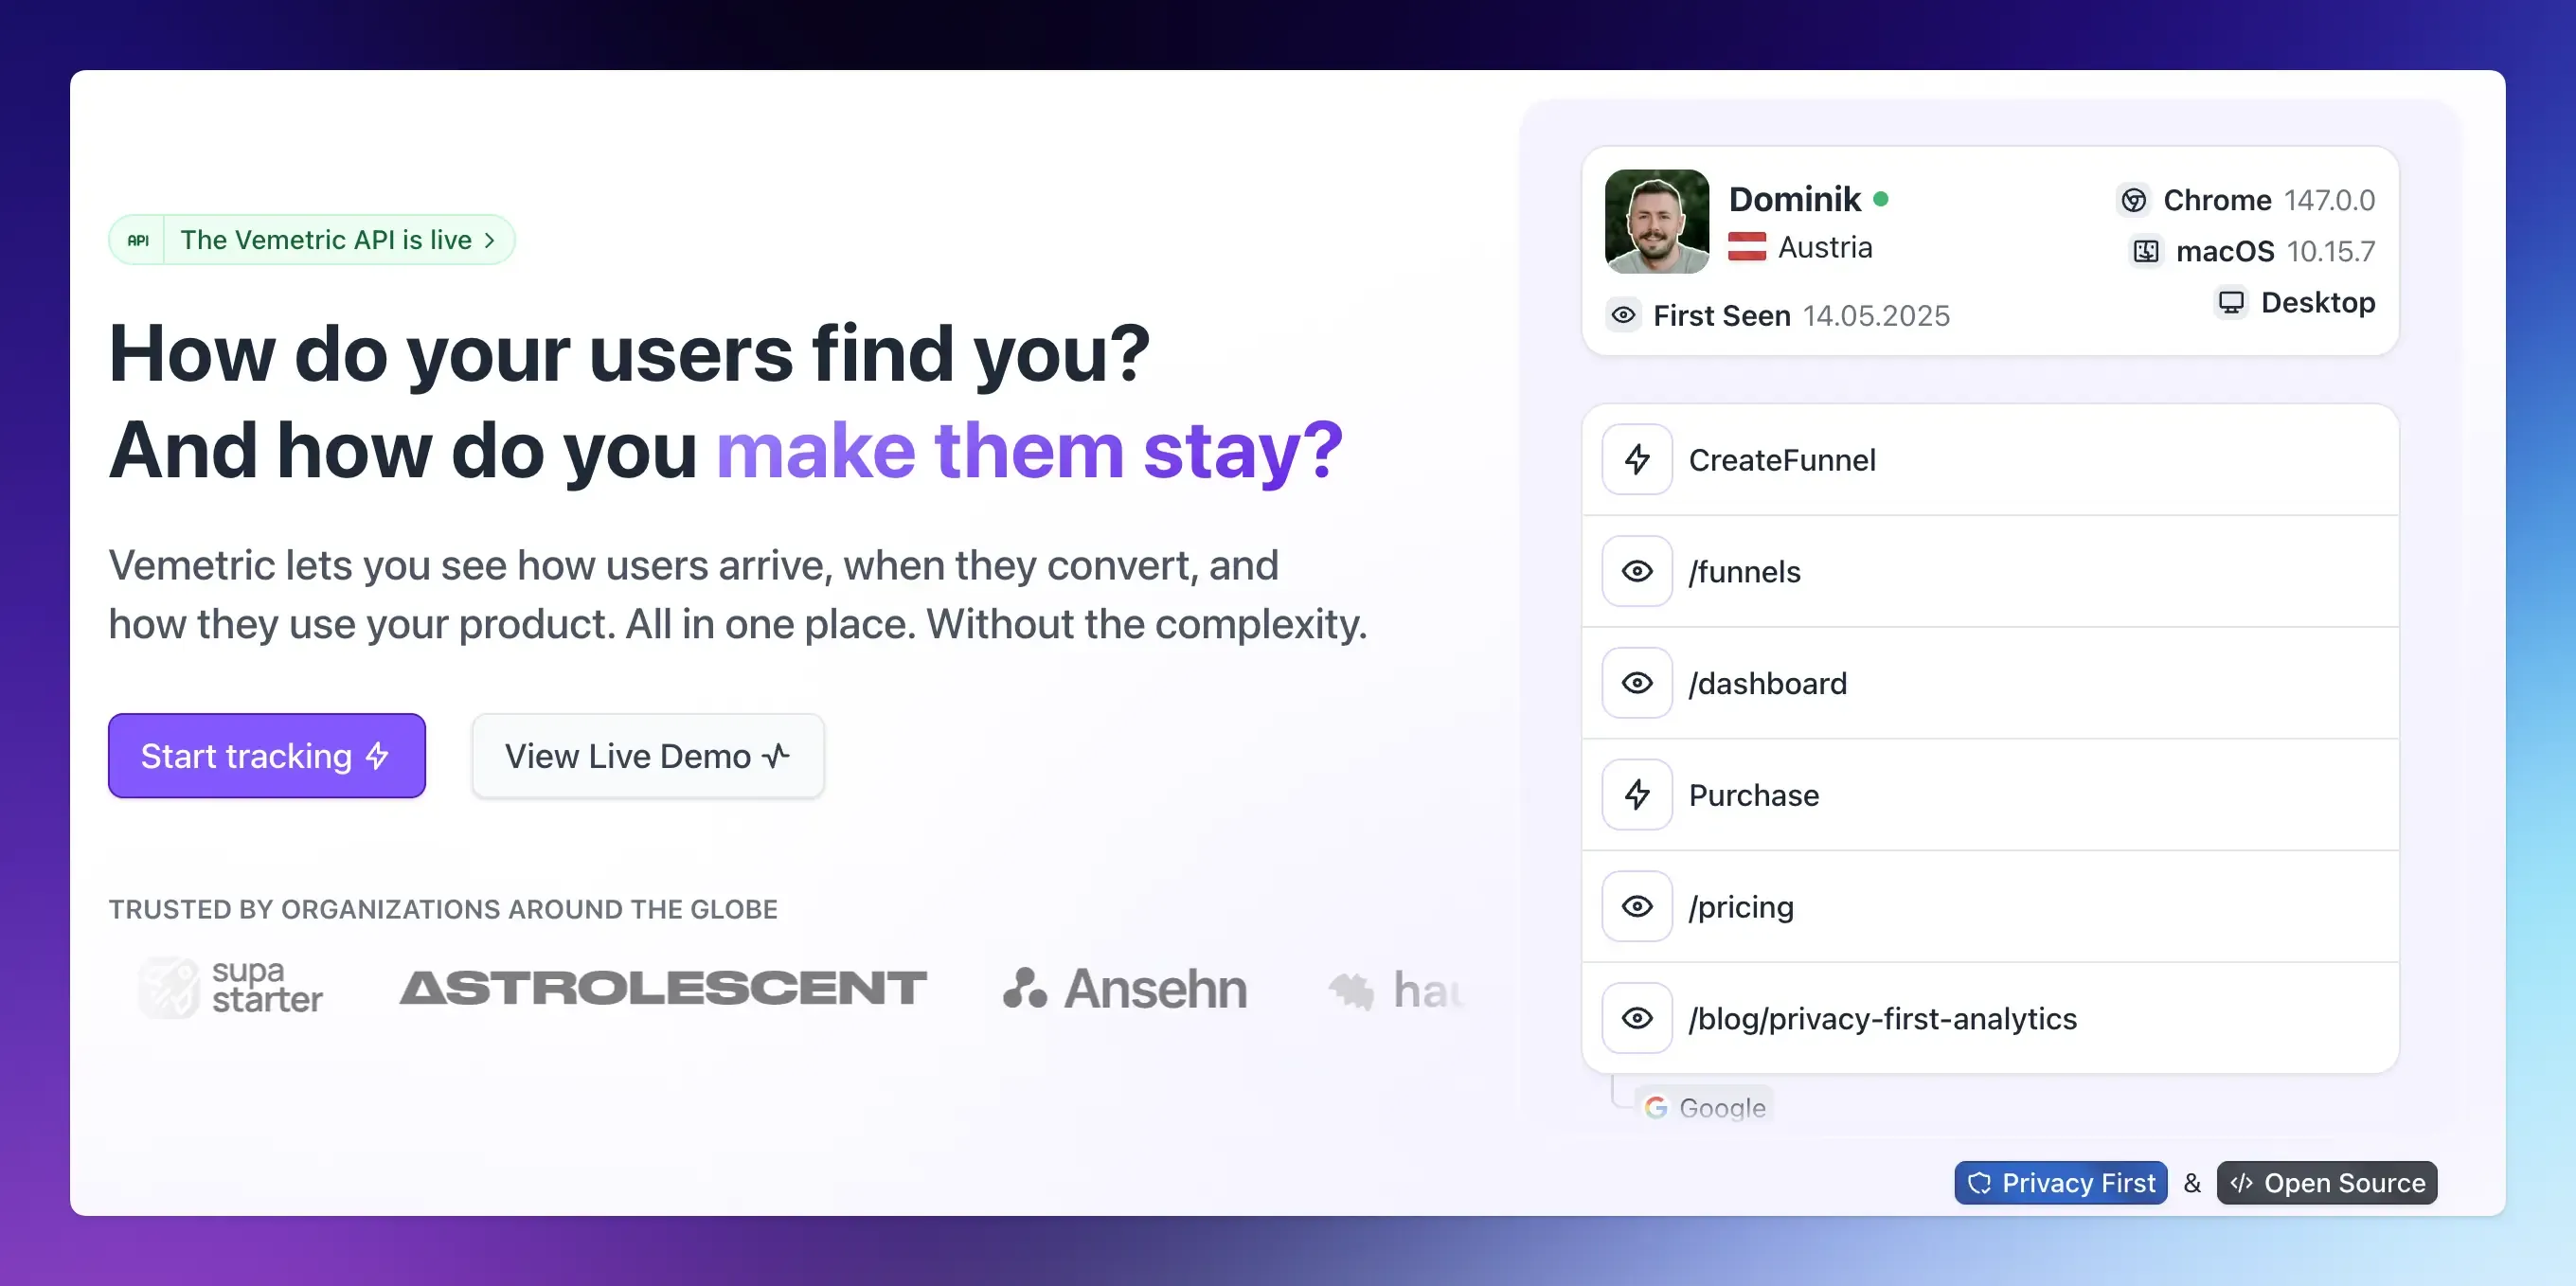
Vemetric is a privacy-first web and product analytics tool built for exactly this workflow: seeing how real users move from signup to value.
- Funnels map every step from signup to your first-value event and show precisely where users drop off, with segment filtering.
- User journeys show each person’s full path, merging their anonymous and logged-in activity, plus an interactive activity heatmap so you can inspect a stalled user directly.
- Event streams provide a real-time, chronological view of every event that fires, so you can verify tracking and watch new flows work as you ship.
- Web plus product analytics in one place connects how users arrive with how they activate, without stitching two tools together.
It is privacy-first by default (no cookies, GDPR-compliant, EU-hosted, open-source) and priced for growing teams, starting free and moving to a low, flat rate as you scale.
FAQs
Yes, indirectly but strongly. Faster TTV lifts activation, and activation is tightly linked to retention and revenue. Userpilot’s data suggests a 25% lift in activation can translate to a 34% increase in MRR over 12 months, because activated users are the ones who stay and pay.
Treat it as an ongoing loop. Set a baseline, ship a change, watch the event stream to confirm it works, then compare the new cohort against the old one. Each fix often reveals the next bottleneck, so plan to iterate rather than optimize once.