Every product team has a graveyard of features nobody asked for a second time.
You shipped them because a big client threatened to leave. Because the loudest voice in the roadmap meeting pushed hard for it. Because it “felt” like the obvious next move. Then a few months pass, you check the numbers, and barely anyone touched it.
That gap between opinion-driven roadmaps and a real data-driven product roadmap is where most engineering time quietly disappears. One approach is a bet. The other is a bet backed by evidence you can actually check.
The good news: closing that gap doesn’t require a data science team.
It requires tracking the right events, reading them correctly, and refusing to treat every feature request as proof of demand.
Here’s exactly how to do it.
What is a Data-Driven Product Roadmap?
A data-driven product roadmap is a roadmap where feature usage data, not requests, opinions, or whoever complains the loudest, decides what gets built, improved, or cut.
Instead of asking “who wants this,” you ask what users are already doing, where they get stuck, and which behaviors actually correlate with retention and revenue.
This doesn’t mean ignoring feedback entirely. It means treating feedback as one input among several, and letting behavioral data break the tie when opinions in the room disagree.
Feature Request vs Feature Usage: Why They Tell Different Stories
Feature requests and feature usage data look like they answer the same question. They don’t.
A feature request tells you what a user thinks they want, filtered through their current understanding of your product, how their week is going, and how persistent they are about asking.
Feature usage data tells you what people actually do when nobody is watching them fill out a survey.
Why “Build What Users Actually Use” Beats “Build What They Ask For”
Here’s the uncomfortable, data-backed truth: most of what teams build never gets used.
According to Pendo’s feature adoption benchmarking research, the median feature adoption rate across software products sits at just 6.4%.
In plain terms, for every 100 features a team plans, builds, and ships, only about 6 of them drive meaningful usage. Even top-performing products only reach 15.6% adoption. That means almost 94% of the average product’s features go largely untouched.
And it’s not because teams are lazy about prioritization. Most simply aren’t prioritizing with data:
- Only 20.9% of product professionals say they use insights from research, data, or discovery to guide prioritization decisions.
- Just 13.5% consistently apply a formal scoring or prioritization framework.
- Only 5.7% use a structured framework like OKRs or a scoring model at all.
- 9% admit they have no consistent prioritization process whatsoever
Feature requests tell you where the noise is. Usage data tells you where the value is.
The roadmaps that actually move retention and revenue are built by teams who know the difference and default to usage data whenever the two disagree.
If you want to see this play out concretely, our guide on feature adoption rate breaks down exactly how to calculate and benchmark it for your own product.
How to Prioritize Features With Data: A Step-by-Step Framework
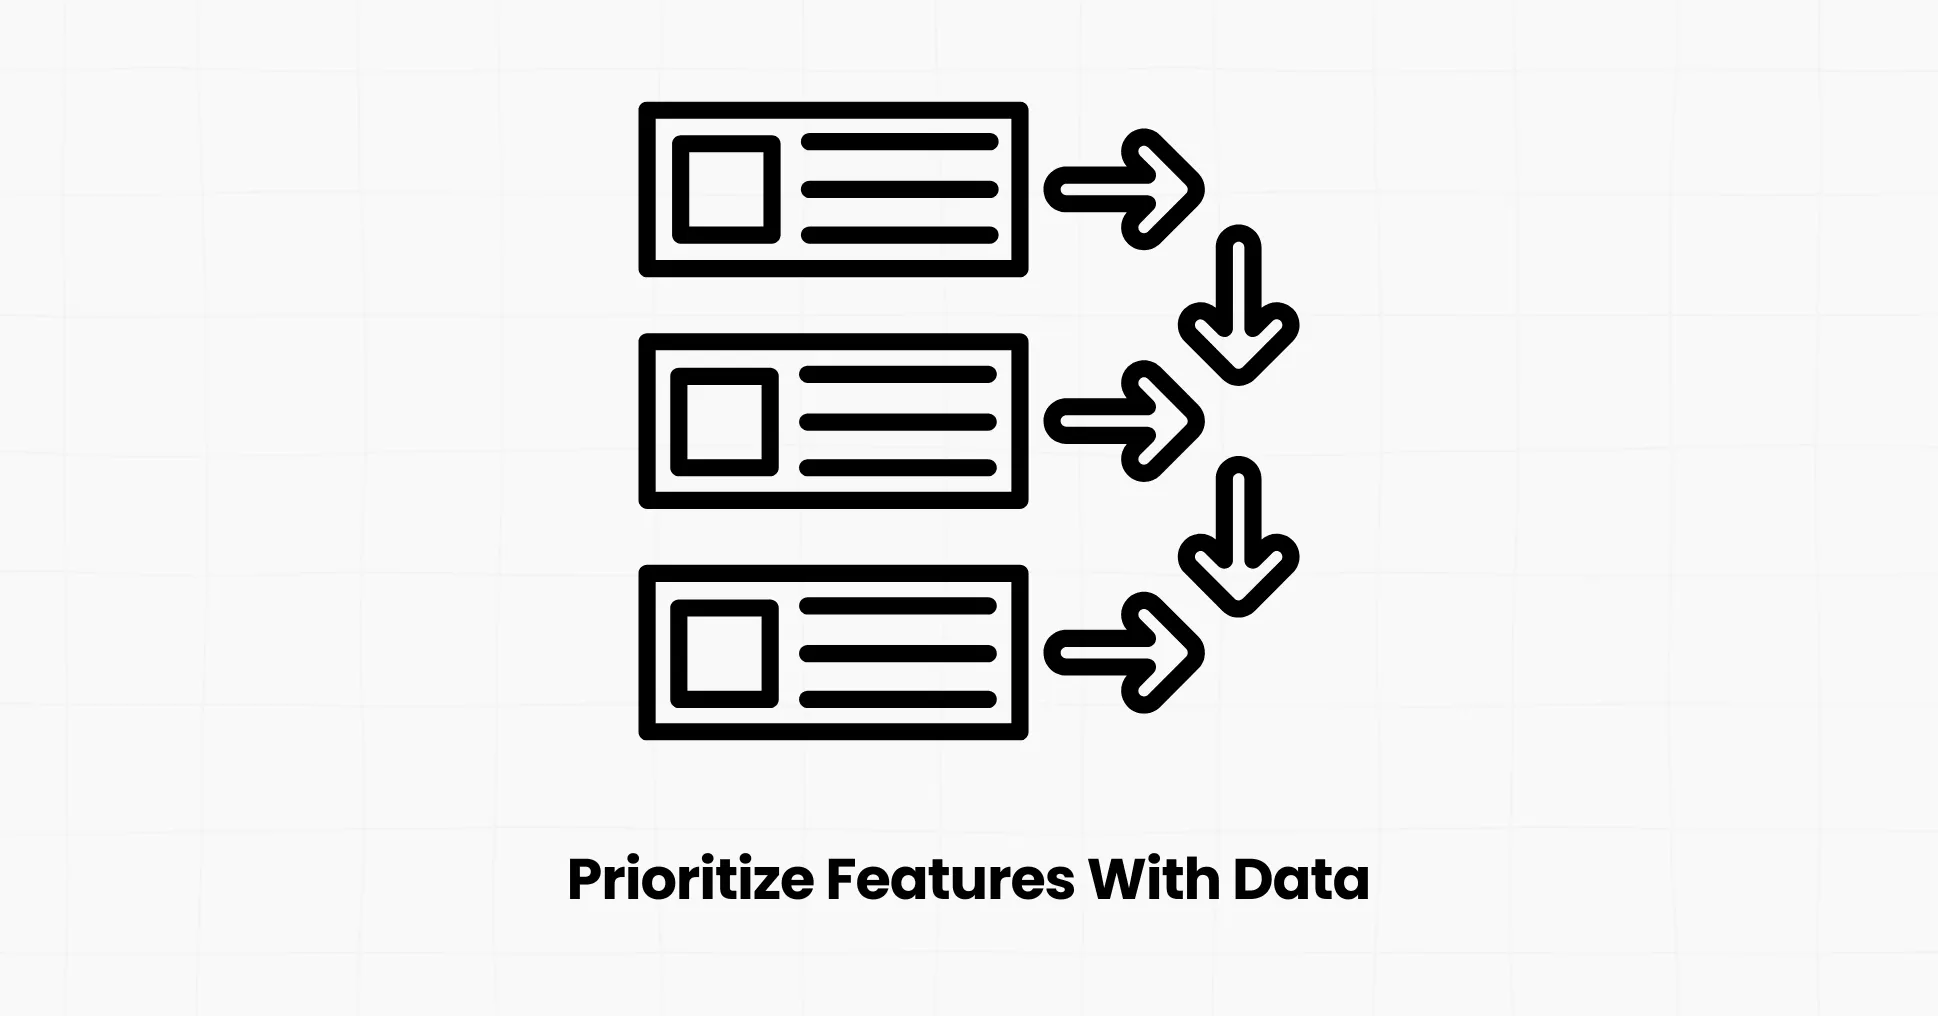
Using product analytics for roadmap decisions doesn’t mean throwing out your intuition. It means building a process where data gets the final say before you write code, and again after it ships.
1. Instrument Every Feature, Not Just Pageviews
Most teams track pageviews and call it analytics. That tells you someone visited a screen, not whether they used what’s on it.
- Define a custom event for every meaningful in-product action (a button click, a completed workflow, a saved report)
- Track events for both new and existing features, not just the one you’re about to launch
- Make sure events fire for anonymous and logged-in users, so you don’t lose the first half of the journey
Our guide on event tracking walks through exactly what counts as a meaningful event and how to set it up without drowning your dashboard in noise.
2. Set a Usage Baseline Before You Build
You can’t measure a new feature’s impact if you don’t know your starting point. Before you commit engineering time to something new, pull the current adoption and engagement numbers for related features already in your product.
This baseline becomes your comparison point later.
Did the new feature actually move the needle, or did it just add to the pile of things at 6% adoption?
3. Score Features With a Simple Usage-Impact Framework
Once you have usage data flowing, score your roadmap candidates against a few weighted factors instead of gut feel alone.
- Reach: How many active users would this touch? % of active users who hit the relevant workflow
- Frequency: How often would it get used? Sessions or events per active user, per week
- Retention impact: Does usage correlate with users staying longer? Compare retention of users who use similar features vs those who don’t
- Effort: What does it cost to build? Engineering estimate, in the same unit as everything else
A rough scoring formula:
(Reach x Frequency x Retention Impact) / Effort
It doesn’t need to be scientific. It needs to force the conversation away from “the last customer who emailed us” and toward evidence everyone in the room can see.
4. Don’t Throw Out Feedback, Weight It
Usage data tells you what’s happening. It rarely tells you why. Pair it with qualitative context so you’re not just optimizing for behavior you don’t fully understand.
- Cross-reference frequently requested features against their actual usage once shipped
- Interview a handful of users who use a feature heavily and a handful who abandoned it
- Use customer journey analytics to see the full path a user took before and after they requested something, not just the request itself.
5. Re-measure After You Ship
Shipping isn’t the finish line; it’s the start of the actual test. Track adoption weekly for the first four to six weeks after launch, then move to monthly tracking once the pattern stabilizes.
Watch for where users drop off in the adoption funnel: aware of the feature, tried it once, came back a second time, made it a habit.
Most teams only track whether someone touched a feature once. The drop-off points in between are where your next roadmap decision usually lives.
The Feature Usage Data That Should Actually Drive Your Roadmap
Not all usage data carries equal weight.
These are the metrics worth building your prioritization process around:
- Feature adoption rate: the percentage of active users who’ve used a specific feature in a given period. Start here if you’re tracking nothing else today.
- Activation rate: whether new users reach the moment your product’s core value clicks for them. Our user activation guide covers how to define and measure it.
- Engagement frequency: How often active users return to a feature. A feature used once and abandoned is a very different signal than one used weekly.
- Retention correlation: Whether users who adopt a feature churn less than those who don’t. This is one of the strongest signals for what to double down on. Our guide on SaaS churn analytics explains how to connect behavioral data to churn risk.
- Funnel drop-off: Exactly where users abandon a multi-step flow, so you know whether to fix a feature or kill it. See our breakdown of AARRR pirate metrics for how this fits into the bigger growth picture.
- Cohort retention over time: Whether usage patterns from a specific signup cohort hold up months later. Our cohort analysis guide shows how to group users correctly so this data stays meaningful.
How Vemetric Turns Usage Data Into Roadmap Decisions
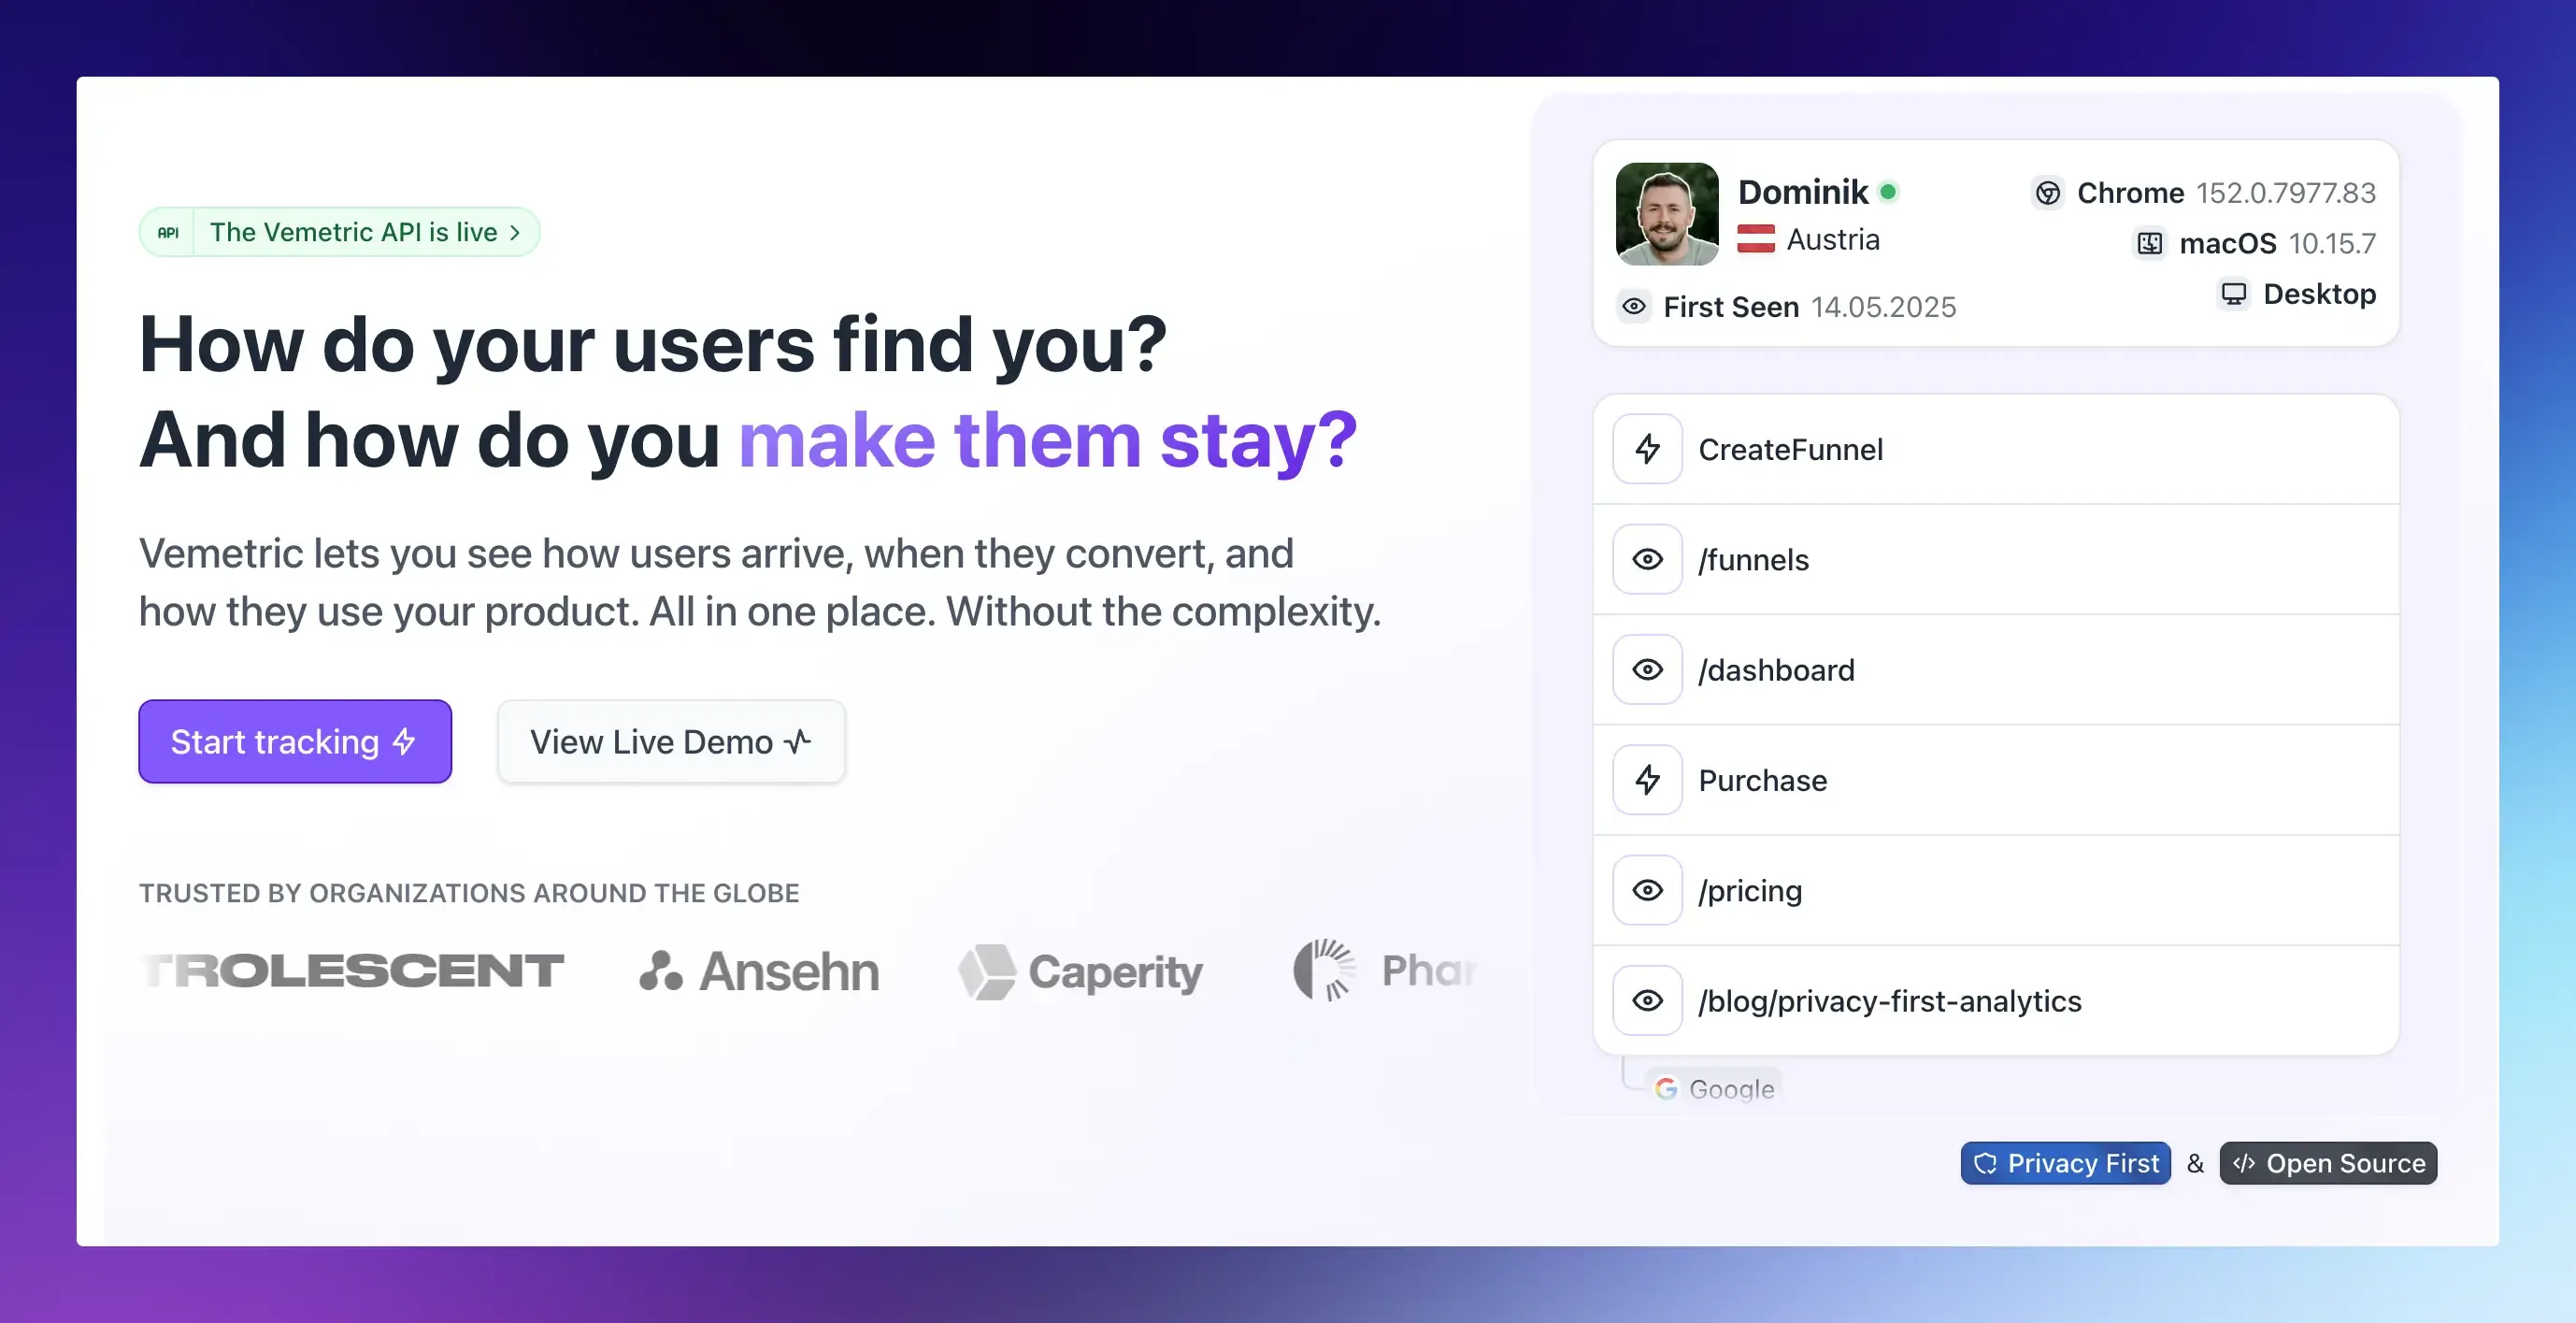
You can’t build a data-driven product roadmap without a way to see what users are actually doing inside your product.
That’s exactly the gap Vemetric is built to close.
- Custom event tracking: Define an event for any feature or action that matters to you, then see exactly how many users triggered it, how often, and in what context, without digging through raw logs.
- Individual user journeys: Open any user’s full timeline, grouped by session and day, to see the exact path they took before and after adopting (or abandoning) a feature. Read more in our user journeys documentation.
- Funnels: Map each step of a feature’s adoption flow to a specific event and instantly see where users drop off, filterable by user segment. Details are in our funnels documentation.
- Filtering by behavior and properties: Slice your usage data by plan type, signup date, or any custom property to see which segments are driving adoption before you build more for everyone.
- Privacy-first by design: No cookies by default, GDPR compliant, EU-hosted, and fully open source, so you get usage data without adding compliance risk to your roadmap.
Start on the free plan (2,500 events per month, no credit card) and scale up as your product grows. Check the pricing page for details, or see how teams like Caperity and Phare already use Vemetric to decide what to build next.
Final Thoughts
A data-driven product roadmap isn’t about removing judgment from product decisions; it’s about giving that judgment something real to stand on.
Feature requests will always be loud. Usage data is what tells you whether that noise reflects your whole user base or just the person who happened to email you this week.
Start small: instrument your top five features this week, set a baseline, and revisit your next roadmap meeting with actual numbers in hand instead of a spreadsheet of requests.
The roadmap conversation changes completely once everyone in the room is looking at the same evidence.
Ready to see what your users are actually doing? Start tracking with Vemetric and get your first usage baseline in minutes.
FAQs
Track adoption weekly for the first four to six weeks after a feature launches, then shift to monthly reviews once the pattern stabilizes. A full roadmap review using usage data works well on a quarterly cycle, though fast-moving products may benefit from monthly check-ins on their top metrics.
Start by instrumenting custom events for your existing features to establish a usage baseline, then score new roadmap candidates on reach, frequency, retention impact, and effort. Weight this scoring against qualitative feedback rather than replacing it, and re-measure adoption for a few weeks after each release to confirm the decision paid off.