Most SaaS founders drown in data but still can’t answer one simple question: where exactly is my growth breaking down?
They track page views, social followers, email open rates, and a dozen other numbers that look impressive in a deck but don’t tell them why users are leaving or what is actually driving revenue.
That is the problem the AARRR framework was built to solve.
This guide covers everything you need to know about AARRR pirate metrics:
- What each stage means
- The benchmarks to aim for
- The mistakes that quietly kill growth
- How to track it all without stitching together five different tools
What Are AARRR Pirate Metrics?
AARRR stands for Acquisition, Activation, Retention, Revenue, and Referral. It is a five-stage growth framework created by Dave McClure, founder of 500 Startups, in his now-famous 2007 “Startup Metrics for Pirates” presentation.
The name “pirate metrics” comes from what the acronym sounds like when you say it out loud: AARRR.
Beyond the joke, the pirate spirit reflects exactly what McClure intended: a scrappy, no-nonsense, results-first mindset for measuring startup growth.
McClure built the framework after watching founders get distracted by vanity metrics: page views, press coverage, and follower counts that looked good in reports but had zero connection to revenue.
His fix was simple. Focus only on the five metrics that actually tell you whether your business is healthy.
The framework maps the complete customer journey, from the moment someone discovers your product to the moment they pay, stay, and send others your way.
Each stage is a checkpoint. Each checkpoint has a measurable conversion rate. And wherever that rate drops, you have found your biggest growth problem.
Why AARRR Still Matters in 2026
Frameworks come and go. AARRR has been around since 2007 and is more widely used today than ever.
Here is why it has lasted:
- It forces you to measure behavior, not just activity. Visitors, signups, and sessions are meaningless without context. AARRR connects actions to outcomes.
- It gives every team a shared language. Marketing owns acquisition. Product owns activation. Customer success owns retention. Everyone knows what they are responsible for.
- It surfaces bottlenecks quickly. If 10,000 people sign up and only 200 ever use the core feature, that is an activation problem. You do not need a data scientist to see it.
- It works at every stage. Whether you have 100 users or 100,000, the same five questions apply.
And with product-led growth becoming the dominant SaaS motion in 2026, the AARRR framework has become even more relevant.
When your product is the primary acquisition and conversion vehicle, understanding exactly where users fall off is not optional. It is the job.
The AARRR Funnel
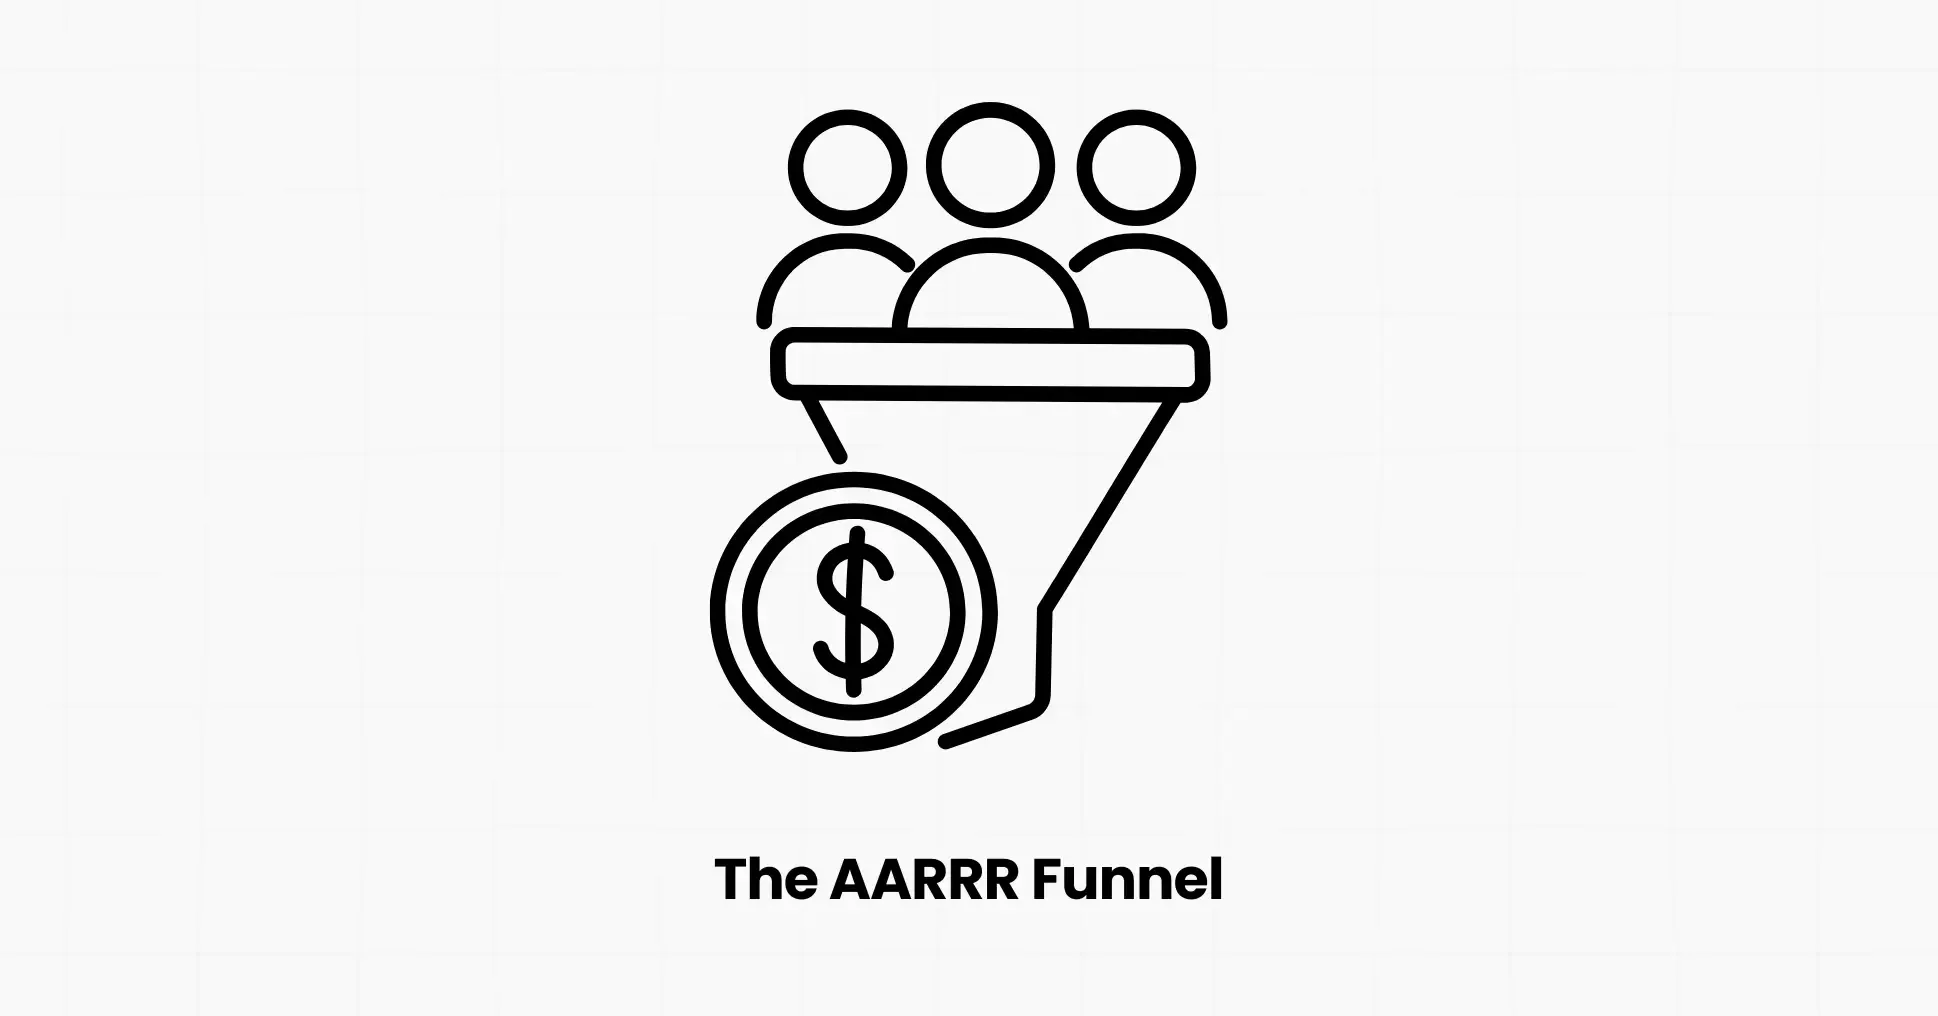
Think of it as a funnel. Users enter at the top and ideally progress through every stage. The funnel gets narrower at each step because not everyone makes it through.
- Acquisition: Visitors find you
- Activation: They experience real value
- Retention: They come back
- Revenue: They pay (and keep paying)
- Referral: They bring others
The real insight here is that a small improvement at each stage compounds into large growth. Fixing one leaky stage does not just help that stage, it lifts every stage below it.
Now let’s break down each one.
Stage 1: Acquisition - How Users Find You

Acquisition is how potential customers first discover your product. It is everything that happens before someone signs up.
For most SaaS companies, acquisition channels include:
- Organic search (SEO and content marketing)
- Paid advertising (Google Ads, LinkedIn, Meta)
- Product-led virality (invite links, embeds, public outputs)
- Partner and integration marketplaces
- Community and word of mouth
- Cold outreach and sales
Key Acquisition Metrics to Track
- Visitor-to-signup conversion rate: What percentage of website visitors create an account?
- Customer Acquisition Cost (CAC): How much does it cost to bring in one new customer?
- CAC by channel: Which channel brings in the highest quality users at the lowest cost?
- Time to first meaningful action: How quickly do new signups do something that matters?
2026 Benchmark
According to data from over 1,200 SaaS companies, visitor-to-lead rates for B2B SaaS average 1.5-2.5%. Top performers achieve 8-15%. If you are below 1.5%, the problem is your landing page, messaging, or traffic quality, not your product.
The Biggest Acquisition Mistake
Optimizing for volume instead of fit. Getting 10,000 signups from the wrong audience will destroy your activation and retention rates.
One of the most impactful things you can do is tighten your targeting so that the people who sign up are the people who actually need what you built.
The right acquisition question is not “how do we get more users?” It is “how do we get more of the right users?”
Stage 2: Activation - The Moment That Changes Everything
Activation is the single most underrated stage of the AARRR funnel. And it is usually where the most users are quietly lost.
Activation is the moment when a new user experiences your product’s core value for the first time.
Once a user hits it, they are far more likely to stick around. Before they hit it, they are one frustrating moment away from leaving and never coming back.
Examples of activation moments:
- Slack: A new user sends a message to a teammate
- Dropbox: A user adds their first file and sees it sync across devices
- Grammarly: A user runs their first check and sees suggestions in their actual document
- A SaaS analytics tool: A user sets up their first event and sees live data appear on the dashboard
The activation event varies by product. Your job is to figure out what it is for you, then remove every obstacle between signup and that moment.
Key Activation Metrics to Track
- Activation rate: Percentage of new signups who complete the key activation event
- Time-to-first-value (TTV): How long does it take from signup to activation?
- Onboarding completion rate: What percentage of users finish the setup flow?
- Drop-off rate by step: Where exactly do users drop off during onboarding?
2026 Benchmark
The average activation rate for SaaS products in 2026 is around 36-37.5%.
A healthy range is generally considered 25 to 40%. If you are below 20%, users don’t find value before they leave. Research shows that improving activation by just 25% can drive a 34% increase in revenue.
Fixing activation is often the highest-ROI growth move available to an early-stage SaaS company.
How to Improve Activation
- Shorten the path to the aha moment. Remove every non-essential signup step.
- Show progress. A checklist or progress bar gives users a clear sense of where they are and what is next.
- Use contextual in-app guidance rather than lengthy tutorials. Help users in the moment, in the context of the action they are trying to take.
- Identify your drop-off steps with funnel analysis. Not all friction is obvious until you see the data.
- Send targeted onboarding emails triggered by behavior, not just time.
Stage 3: Retention - The Stage That Makes or Breaks SaaS
If acquisition is the front door and activation is the welcome mat, retention is the foundation on which the entire building sits.
Retention measures how many users come back to your product after their first experience. In SaaS, retention is everything.
A business with 90% monthly retention and slow acquisition will eventually outgrow a business with 70% retention and aggressive acquisition. The math is unforgiving.
The old saying is still true: it costs 5 to 25 times as much to acquire a new customer as to retain an existing one. And a 5% increase in retention can boost profits by 25-95%.
Key Retention Metrics to Track
- Day 1, Day 7, Day 30 retention: What percentage of users return at each interval?
- Monthly Active Users (MAU) and Daily Active Users (DAU): Is your active base growing?
- Feature retention: Are users engaging with core features over time, or just logging in?
- Churn rate: What percentage of customers cancel each month?
- Gross Revenue Retention (GRR): What percentage of MRR do you keep from existing customers, excluding expansion?
- Net Revenue Retention (NRR): Same as GRR but including upsells and expansions. The metric investors love.
2026 Benchmarks
According to the 2025 Recurly Churn Report, the B2B SaaS average monthly churn rate is 3.5%, with top performers staying below 2%.
At a 2% monthly churn rate, the average customer lifetime is around 50 months. At 5%, it drops to 20 months.
Pendo’s 2025 benchmark data shows that SaaS software retains an average of 39% of users after 1 month and 30% after 3 months.
The top 10% of products retain nearly twice as many customers as the average.
For revenue retention, the median NRR for B2B SaaS is around 106%, with enterprise segments hitting 115-125% due to expansion revenue.
An NRR above 100% means your existing customers are generating more revenue over time, even before you acquire a single new one.
Stage 4: Revenue - Turning Active Users Into Paying Customers
Retention keeps users. Revenue powers the engine that funds everything else.
For SaaS companies, the revenue stage covers everything that happens between a user experiencing value and that value being exchanged for money.
This includes free-to-paid conversions, plan upgrades, seat expansions, and renewals.
Key Revenue Metrics to Track
- Free-to-paid conversion rate: What percentage of free or trial users become paying customers?
- Monthly Recurring Revenue (MRR) and Annual Recurring Revenue (ARR): Your baseline revenue health.
- Average Revenue Per User (ARPU): How much does each customer pay you on average?
- Expansion MRR: Revenue growth from upgrades and upsells within your existing customer base.
- LTV: CAC ratio: For every dollar spent acquiring a customer, how much lifetime value do they generate? A healthy ratio is 3:1 or higher.
- CAC Payback Period: How many months does it take to recover what you spent to acquire a customer?
2026 Benchmark
Free-to-paid conversion rates have been declining. Median rates dropped to around 34% by 2025, down from 50% in 2023.
Freemium models typically convert at 3-5%, while opt-out trials (credit card required upfront) convert at nearly 49%.
The drop in conversion rates is a signal: getting users to pay requires more upfront value delivery than ever before.
The companies winning revenue in 2026 are the ones that help users hit their goals before asking them to pull out a credit card.
Revenue Optimization Levers
- Get users to value faster. Delivering a clear win within the first 7 days dramatically increases conversion.
- Use behavior-triggered upgrade prompts. When a user hits a usage limit or wants to access a power feature, that is the moment to show a pricing page, not after a fixed 14-day trial window.
- Make pricing transparent. Transparent pricing models outperform “Contact Sales” approaches by 15-25% in self-service SaaS.
- Focus on expansion revenue. Getting existing customers to upgrade is significantly cheaper than acquiring new ones. Companies that track and optimize expansion MRR consistently achieve NRR above 110%.
Stage 5: Referral - The Growth Loop Most Teams Ignore
Referral is the final stage of AARRR and often the most neglected. It is also, when done right, the most efficient growth lever available.
Referral happens when your existing users actively bring new users into your product. Not because you paid them to, but because the product is genuinely valuable enough that they want to share it.
Referrals carry a level of trust that no ad campaign can replicate.
A recommendation from a trusted peer converts at dramatically higher rates and brings in users with better retention than almost any paid channel.
Key Referral Metrics to Track
- Viral coefficient (K-factor): How many new users does each existing user bring in on average? K = (invitations sent per user) x (conversion rate of those invitations)
- Net Promoter Score (NPS): A directional signal of how likely users are to recommend you
- Referral conversion rate: Of all users who click a referral link, what percentage becomes active users?
- Referral-driven MRR: What share of your revenue comes from referred customers?
2026 Benchmark
Most SaaS products achieve a viral K-factor of 0.1-0.5. A K-factor above 1.0 means genuine exponential organic growth. Even a K-factor of 0.2 meaningfully reduces your CAC because a meaningful percentage of your new user base arrives without you spending anything on acquisition.
How to Build Referral Into Your Product
- Build natural sharing moments into the product experience. If users create something shareable, the outputs that go public carry your brand with them.
- Make collaboration a core feature. Products that are inherently better with more team members have a referral built into their value proposition.
- Track which referral sources produce your highest-LTV customers. Referred users from power users are often worth more than those from occasional users.
How to Track AARRR Metrics Without a Data Team
The biggest reason founders do not implement AARRR properly is friction.
Setting up event tracking, stitching together web analytics with product analytics, and building usable dashboards used to require dedicated engineering resources.
That is no longer true.
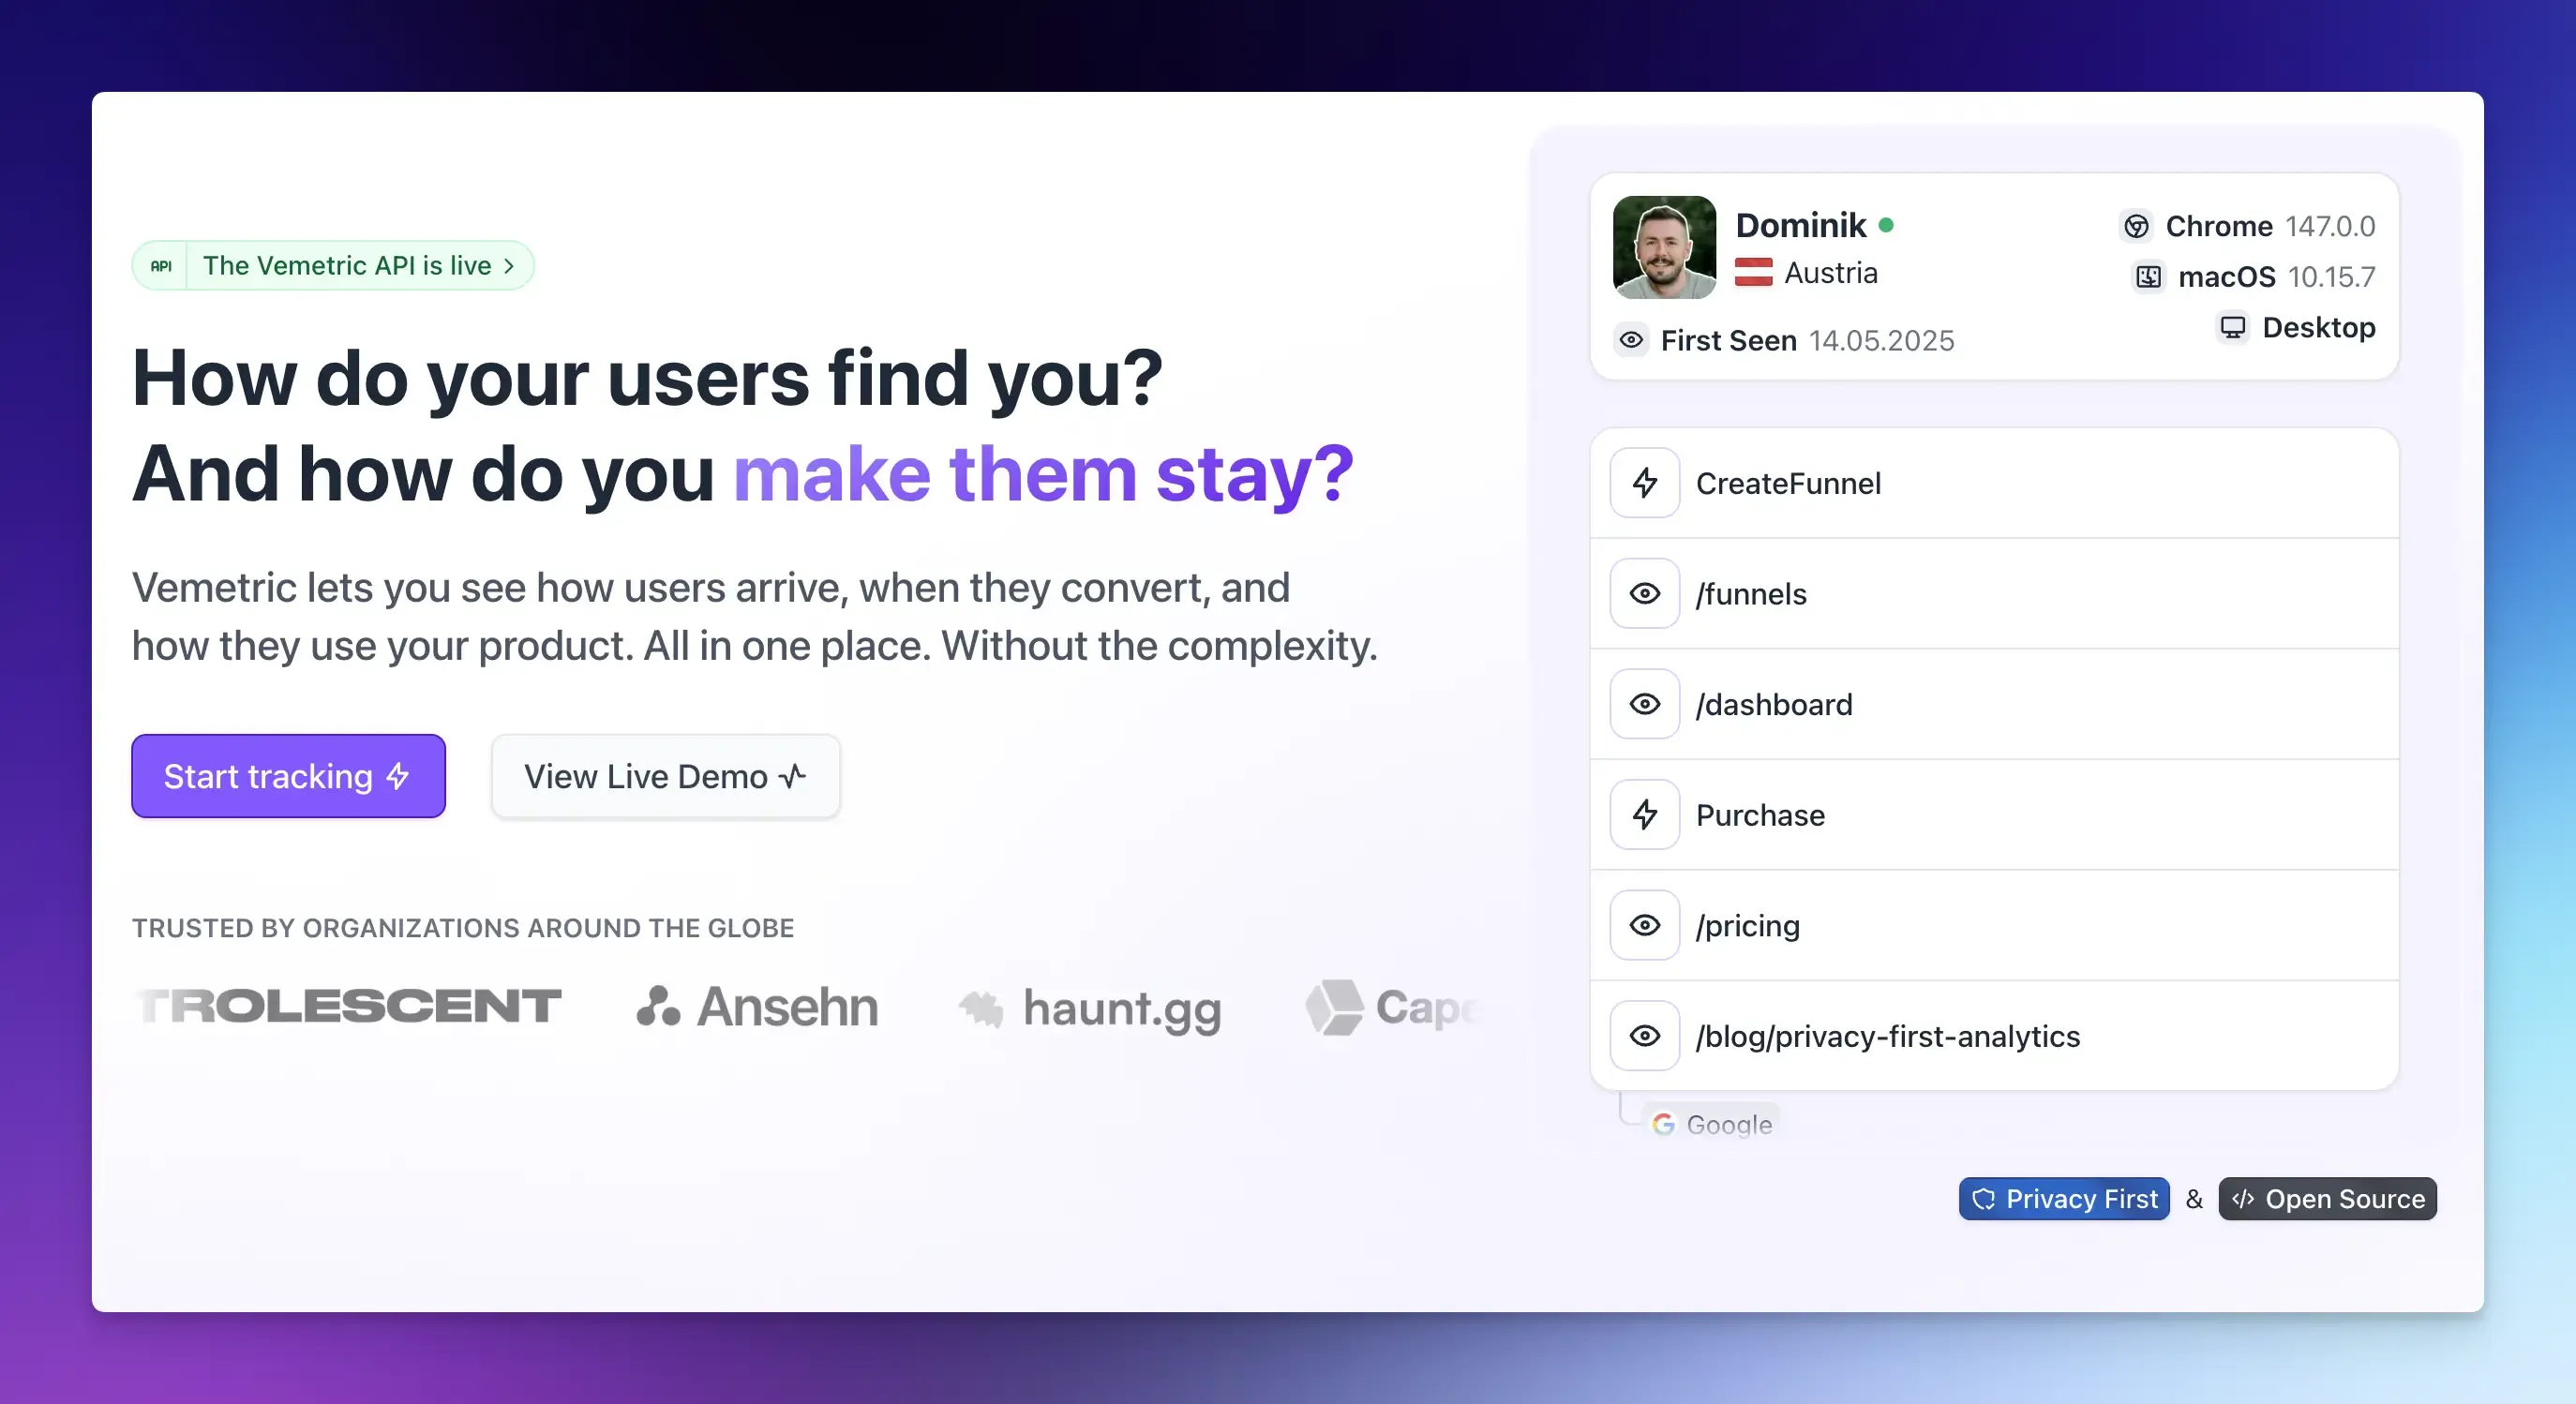
Tools like Vemetric are built specifically for this problem. Vemetric combines web analytics and product analytics in a single platform, so you can see where users come from (acquisition), how they move through your product (activation and retention), and where they drop off, all in one place.
Key features that directly support AARRR tracking:
- Funnel analysis: Map any sequence of events or pageviews into a funnel and see exactly where users drop off. Segment by user type, traffic source, or any property.
- User journeys: See the complete path each user takes, including their anonymous pre-signup behavior and all post-signup activity.
- Event streams: A chronological view of every action happening in your product, filterable by user segment or event type.
- Web analytics built in: See referral sources, top pages, and traffic channels without needing a separate tool.
- Privacy-first by default: Vemetric does not use cookies by default and is fully GDPR-compliant. You get clean data without the compliance headache.
For early-stage SaaS founders, Vemetric removes the biggest barrier to implementing AARRR properly: the complexity of setting it up.
You do not need a data engineer. You do not need to reconcile numbers across three different dashboards. You need one tool that tracks the full user journey from first visit to power user.
FAQs
RARRA reverses the order to Retention, Activation, Referral, Revenue, Acquisition. Use it when you are pre-product-market fit, or your churn is above the benchmark. Fix the leaks before filling the funnel.
No. Start with five to ten key events, one per stage. A tool like Vemetric combines web and product analytics into a single dashboard so that you can track the full funnel without any engineering overhead.