SaaS Churn Analytics: Use Behavioral Data to Predict and Prevent Churn
You check your MRR dashboard. A handful of cancellations this week. You look at the accounts, pull up their profiles, and ask the question every SaaS founder dreads: “Why did they leave?”
By that point, it does not matter. They are gone.
Here is the brutal reality of SaaS churn: only 1 out of 26 unhappy customers ever complains before they cancel.
The other 25 disappear. That means the vast majority of churn is completely invisible to you if you are relying on support tickets, NPS responses, or exit surveys to catch it.
The companies that consistently outperform on retention are not smarter at damage control. They are smarter at reading the signals that come weeks before a user ever thinks about canceling.
That is exactly what SaaS churn analytics with behavioral data is built to solve.
This guide will walk you through the behavioral signals that predict churn, how to act on them before it is too late, and how a product analytics tool like Vemetric gives you the visibility to do so without the complexity of enterprise-level tooling.
What SaaS Churn Analytics Actually Means
Churn analytics is not just tracking how many users left this month. That is a lagging indicator. It tells you what already happened.
True churn analytics, specifically behavioral churn analytics, is about tracking the in-product actions (or inactions) that predict whether a user is about to leave. It shifts your focus from retrospective reporting to proactive intervention.
The inputs are behavioral signals:
- Which features users interact with
- How often they log in
- Where they drop off inside your product
- How their usage patterns change over time.
When you connect these signals to actual churn outcomes, patterns emerge. And those patterns become your early warning system.
The Behavioral Signals That Predict Churn
Early warning systems built on behavioral data can identify at-risk customers 60 to 90 days before they actually churn. That window is everything.
Here are the signals worth tracking.
1. Login Frequency Drop
A user who logged in daily and now logs in once a week is telling you something. They have not canceled yet, but their habit is breaking. Habit breaks are among the strongest leading indicators of churn in self-serve SaaS.
The threshold matters here. A one-week drop during a holiday period is noise.
A sustained two-to-three-week decline in login frequency, especially when it is unprompted, is a signal worth acting on.
What to do: Track weekly active usage per user, not just at the account level. Flag any user who drops below their personal baseline by more than 50% for two consecutive weeks.
2. Feature Abandonment
There is a specific set of features inside your product that correlates with long-term retention. Users who discover and regularly use these “sticky” features churn at dramatically lower rates than those who use only surface-level functionality.
Feature usage churn correlation is one of the most powerful analyses you can run.
You take a cohort of churned users and a cohort of retained users, then compare which features each group used in their first 30 and 60 days.
The delta shows you exactly which feature adoption drives retention.
For most SaaS products, this analysis reveals a clear pattern:
Users who reach a specific activation milestone (a feature used a certain number of times, or a workflow completed end-to-end) are two to three times less likely to churn.
What to do: Define your “core activation event” based on this analysis. Make reaching that event the explicit goal of your onboarding flow.
3. Funnel Drop-Off Patterns
Where users drop off inside your product is as important as what they do.
A user who starts a workflow and never completes it is experiencing friction. Repeated incomplete workflows signal that the product is not delivering the expected value.
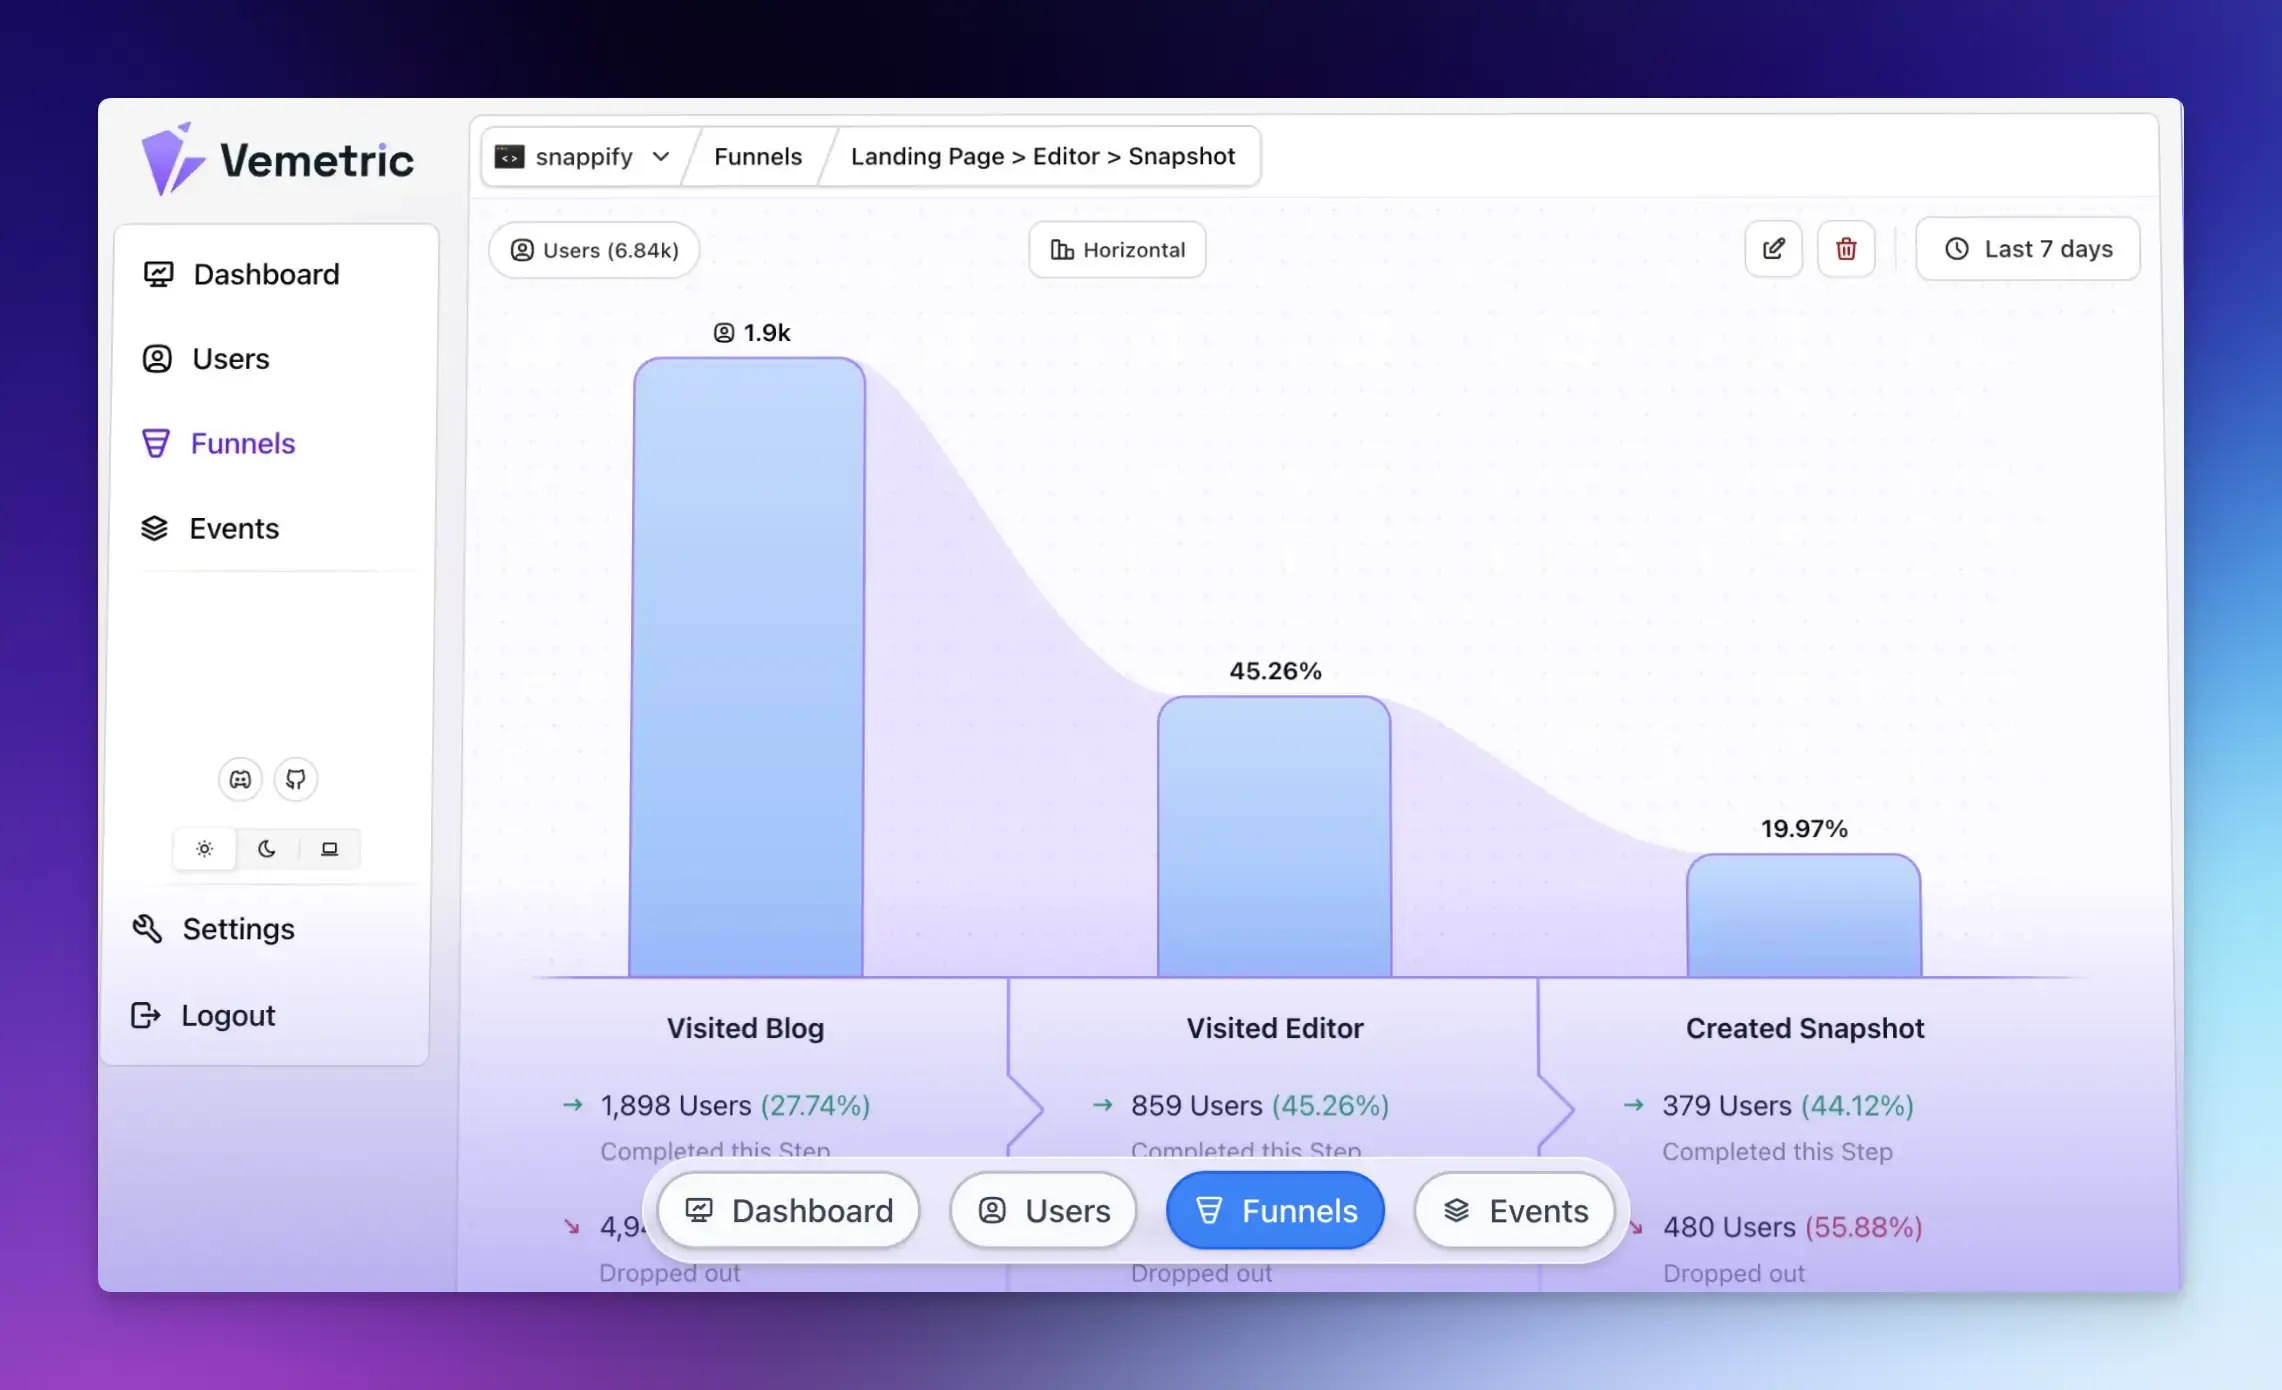
Funnel analysis lets you visualize the drop-off points step by step.
You can see whether users get stuck at a specific step, how drop-off rates differ across user segments, and whether new users are getting stuck in the same place churned users once did.
Vemetric’s funnel feature lets you map each step of your conversion or activation flow to a specific page view or event, and then view the funnel progress of individual users.
That individual-level visibility is critical because it lets you intervene on a specific user before they churn, not just optimize the funnel at a population level.
4. Support and Error Events
A spike in error events or a pattern of repeated failed actions inside your product is a churn signal.
Users who encounter repeated friction and do not reach out to support are not satisfied customers quietly tolerating a bug.
They are users who have mentally moved on and are just waiting to cancel at their next billing cycle.
5. Engagement With Upgrade and Expansion Features
On the flip side, users who visit pricing pages, explore advanced features they have not yet unlocked, or invite team members are exhibiting expansion signals.
These are your most valuable users, and knowing who they are lets you prioritize them for proactive outreach that converts them into power users or upgrades their plans.
6. Session Length and Depth
A user with a declining session length is doing less inside your product on each visit.
Combined with declining login frequency, this is a two-factor churn signal that is hard to argue with. Separately, short but high-frequency sessions can indicate a healthy “checking in” behavior pattern. Context from the full session data matters.
How to Build a Churn Prediction Framework with Product Analytics
Knowing the signals is one thing. Building a systematic process to act on them is another.
Here is a practical framework.
Step 1: Define Your Activation Milestone
Before you can predict churn, you need to understand what success looks like in your product. The activation milestone is the moment when a user has experienced enough value to be likely to stick around.
Run a cohort comparison: users who churned in their first 60 days versus users who stayed beyond 90 days. What did the retained users do in their first two weeks that churned users did not? That delta is your activation event.
Common examples:
- Project created and shared
- Report generated and exported
- Workflow runs end-to-end
- A team member is invited.
Once you have identified this event, it becomes your north star for onboarding optimization.
Step 2: Segment Users by Engagement Tier
Not all users need the same intervention. Segment your active user base by engagement level.
Highly engaged users are your advocates.
Moderately engaged users are your opportunity.
Disengaged users are your churn risk. Identify which tier each user falls into based on login frequency, feature breadth (the number of distinct features they use), and progress through core workflows.
This segmentation lets you prioritize retention efforts. You are not running the same re-engagement campaign for a user who logs in daily and for a user who has not logged in for 3 weeks.
Step 3: Map Behavioral Events to Churn Risk
In Vemetric, you track custom events throughout your product. Each meaningful user action, completing a setup step, using a key feature, or sharing output with a colleague, can be tracked as an event.
Over time, the presence or absence of these events in a user’s activity log becomes the basis for your churn risk score.
You do not need a machine learning model to start.
A simple rules-based approach works: if a user has not triggered Event A in the last 14 days and their login frequency has dropped by more than 40%, flag them as at-risk.
Refine the rules as you gather more data.
Step 4: Create Intervention Playbooks
Once a user is flagged as at-risk, what happens next?
This is where most teams drop the ball. They have the data but no defined response.
Build a playbook for each risk tier.
For mildly disengaging users: an automated in-app prompt surfacing a feature they have not yet discovered.
For significantly disengaged users: a personalized outreach email from the founder or a customer success manager. For critically at-risk users: a direct call or a personalized video walkthrough.
The key is that the intervention is triggered by behavioral data, not by a calendar reminder or a gut feeling.
Step 5: Close the Loop with Cohort Analysis
Track whether your interventions are working by comparing pre-intervention and post-intervention cohorts.
Did the users who received the re-engagement email retain at a higher rate over the following 60 days?
Did the users who completed the activation milestone in their first two weeks churn at a lower rate?
This feedback loop turns your churn prevention analytics into a system that improves over time, not a one-time campaign.
The First 90 Days: Where Churn Is Won or Lost
One of the most consistent findings across the 2025 and 2026 SaaS benchmark data is that 60-70% of annual churn occurs within the first 90 days.
This means that your onboarding experience is the single highest-leverage investment you can make in retention.
First-90-day churn is rarely about the product being fundamentally wrong for the user.
It is about the user not experiencing the right value at the right time.
They signed up for a job to be done. If they do not complete that job within the first two or three weeks, the urgency fades, other priorities take over, and your product becomes an unused subscription.
Behavioral data from the first 90 days tells you whether onboarding is working. The questions to answer: Are new users reaching the activation milestone?
How many sessions does it take them to get there? Which steps in the onboarding flow are causing drop-off?
Are users who complete onboarding in their first week retained at a higher rate than those who complete it in their third week?
These are answerable questions with product analytics. Without the data, you are guessing.
Combining Web Analytics and Product Analytics for Full-Funnel Retention
Churn does not begin when a user logs in.
It begins with the expectation set during acquisition.
A user who signed up because of a marketing claim that your product does not actually deliver on will churn regardless of how good your in-app onboarding is.
This is why combining web analytics and product analytics in a single view is genuinely powerful.
When you can see:
- How a user arrived
- What content they read
- What landing page converted them
Then trace their path through the product from signup to activation (or dropout), you understand the full story.
Vemetric is built on exactly this philosophy.
It covers both web analytics, including top pages, referrer sources, and ChatGPT or AI referral detection, and product analytics, including user journeys, funnel tracking, and event streams.
You do not need two separate tools stitched together with a shared user ID. The data lives in one place, and the user journey is visible from first touch to last session.
This matters for churn analytics because it lets you segment at-risk users by acquisition source and see which channels are producing users who churn faster.
A user who found you via organic search for a specific use case may activate more quickly than one who signed up through a broad paid campaign.
That signal should inform where you spend your acquisition budget, not just how you design your onboarding.
Practical Churn Prevention Checklist
Here is a concise checklist you can bring to your next retention review.
Data Foundation
- Are you tracking custom events for all meaningful in-product actions?
- Can you view the full session history of an individual user?
- Do you have funnel visualization for your key activation flow?
- Are you tracking feature usage at the per-user level?
Signal Identification
- Have you defined your core activation milestone based on cohort data?
- Do you know which three to five features have the highest correlation with 90-day retention?
- Have you mapped your typical “churn pattern” (the behavioral sequence that precedes most cancellations)?
Intervention System
- Do you have a defined threshold for flagging at-risk users?
- Does each risk tier have a corresponding intervention playbook?
- Are your interventions triggered automatically based on behavioral events?
Measurement
- Are you tracking intervention effectiveness with before-and-after cohort comparisons?
- Do you have a monthly retention review that connects behavioral data to churn outcomes?
FAQs
No. A product analytics tool like Vemetric, combined with custom event tracking for your key in-product actions, gives you everything you need to start building a churn prediction and prevention system.
Key churn signals include decreased login frequency, not achieving activation milestones in 30 days, abandoning workflows, and limited feature usage. When multiple signals are present, churn risk significantly increases.
Ready to understand your users?
Start tracking