How to Reduce SaaS Churn Using Product Analytics in 2026
Customer churn can slowly kill your SaaS business.
Every customer who leaves takes recurring revenue with them, and replacing that revenue costs significantly more than retaining it.
If you are a product owner trying to reduce SaaS churn, product analytics is one of the most powerful tools available to you.
This guide breaks down what churn really means, why it happens, and how to use data to stop it before it starts.
Keep reading to learn the key metrics to you need to track and practical strategies to keep more customers happy.
What is SaaS Churn and Why does it Happen?
SaaS churn is the rate at which customers cancel their subscriptions or stop using your product over a given period.
It is typically expressed as a percentage of total customers or monthly recurring revenue (MRR) lost in a month or quarter.
Even a small churn rate can become a major problem over time.
A 5% monthly churn rate means you lose more than half of your customer base within a year.
That is unsustainable growth for SaaS companies, no matter how impressive your acquisition numbers look.
There are two main types of churn you need to look out for:
- Customer churn indicates how many users actually cancel or stop renewing.
- Revenue churn measures the MRR lost, including downgrades.
Both matter, but the revenue churn rate tells you the real business impact, because a single high-value cancellation can hurt more than losing 10 small accounts.
Why Customers Churn: The Real Reasons
Before you can reduce churn, you need to understand why it happens.
Most SaaS churn falls into a few predictable categories.
- Poor Customer Onboarding Process. If a new user signs up and does not get a meaningful outcome in their first week, they quietly disengage and leave. This usually happens when the onboarding experience is generic or too long.
- Low Feature Adoption. Many users stick to one or two basic features and never discover the ones that drive real value. Low adoption of high-value features is a direct churn risk, as users who do not see your product’s core value are far more likely to leave.
- Inefficient Customer Support. When users run into problems and receive no immediate support, they lose confidence in the product. A single bad support experience can end a subscription.
- Bad Product-Market Fit. If your product does not evolve with customer needs and market changes, they eventually outgrow it or switch to a competitor.
How Product Analytics Helps You Reduce SaaS Churn
Product analytics tracks how customers use your product. Instead of guessing why someone left, you can see exactly what they did (or didn’t do) before they churned.
Good product analytics tracks things like:
- Which features are used most and least often?
- Where users drop off during onboarding.
- How frequently users log in and engage over time.
- Which user actions are linked to long-term retention?
- Which customer segments are most at risk?
With this data, you move from reactive churn management to proactive churn prevention.
You can see real user journeys and engagement patterns, learn which steps in your signup flow lose the most people, and spot early warning signs days or weeks before a customer cancels.
Tools like Vemetric are built specifically for this purpose.
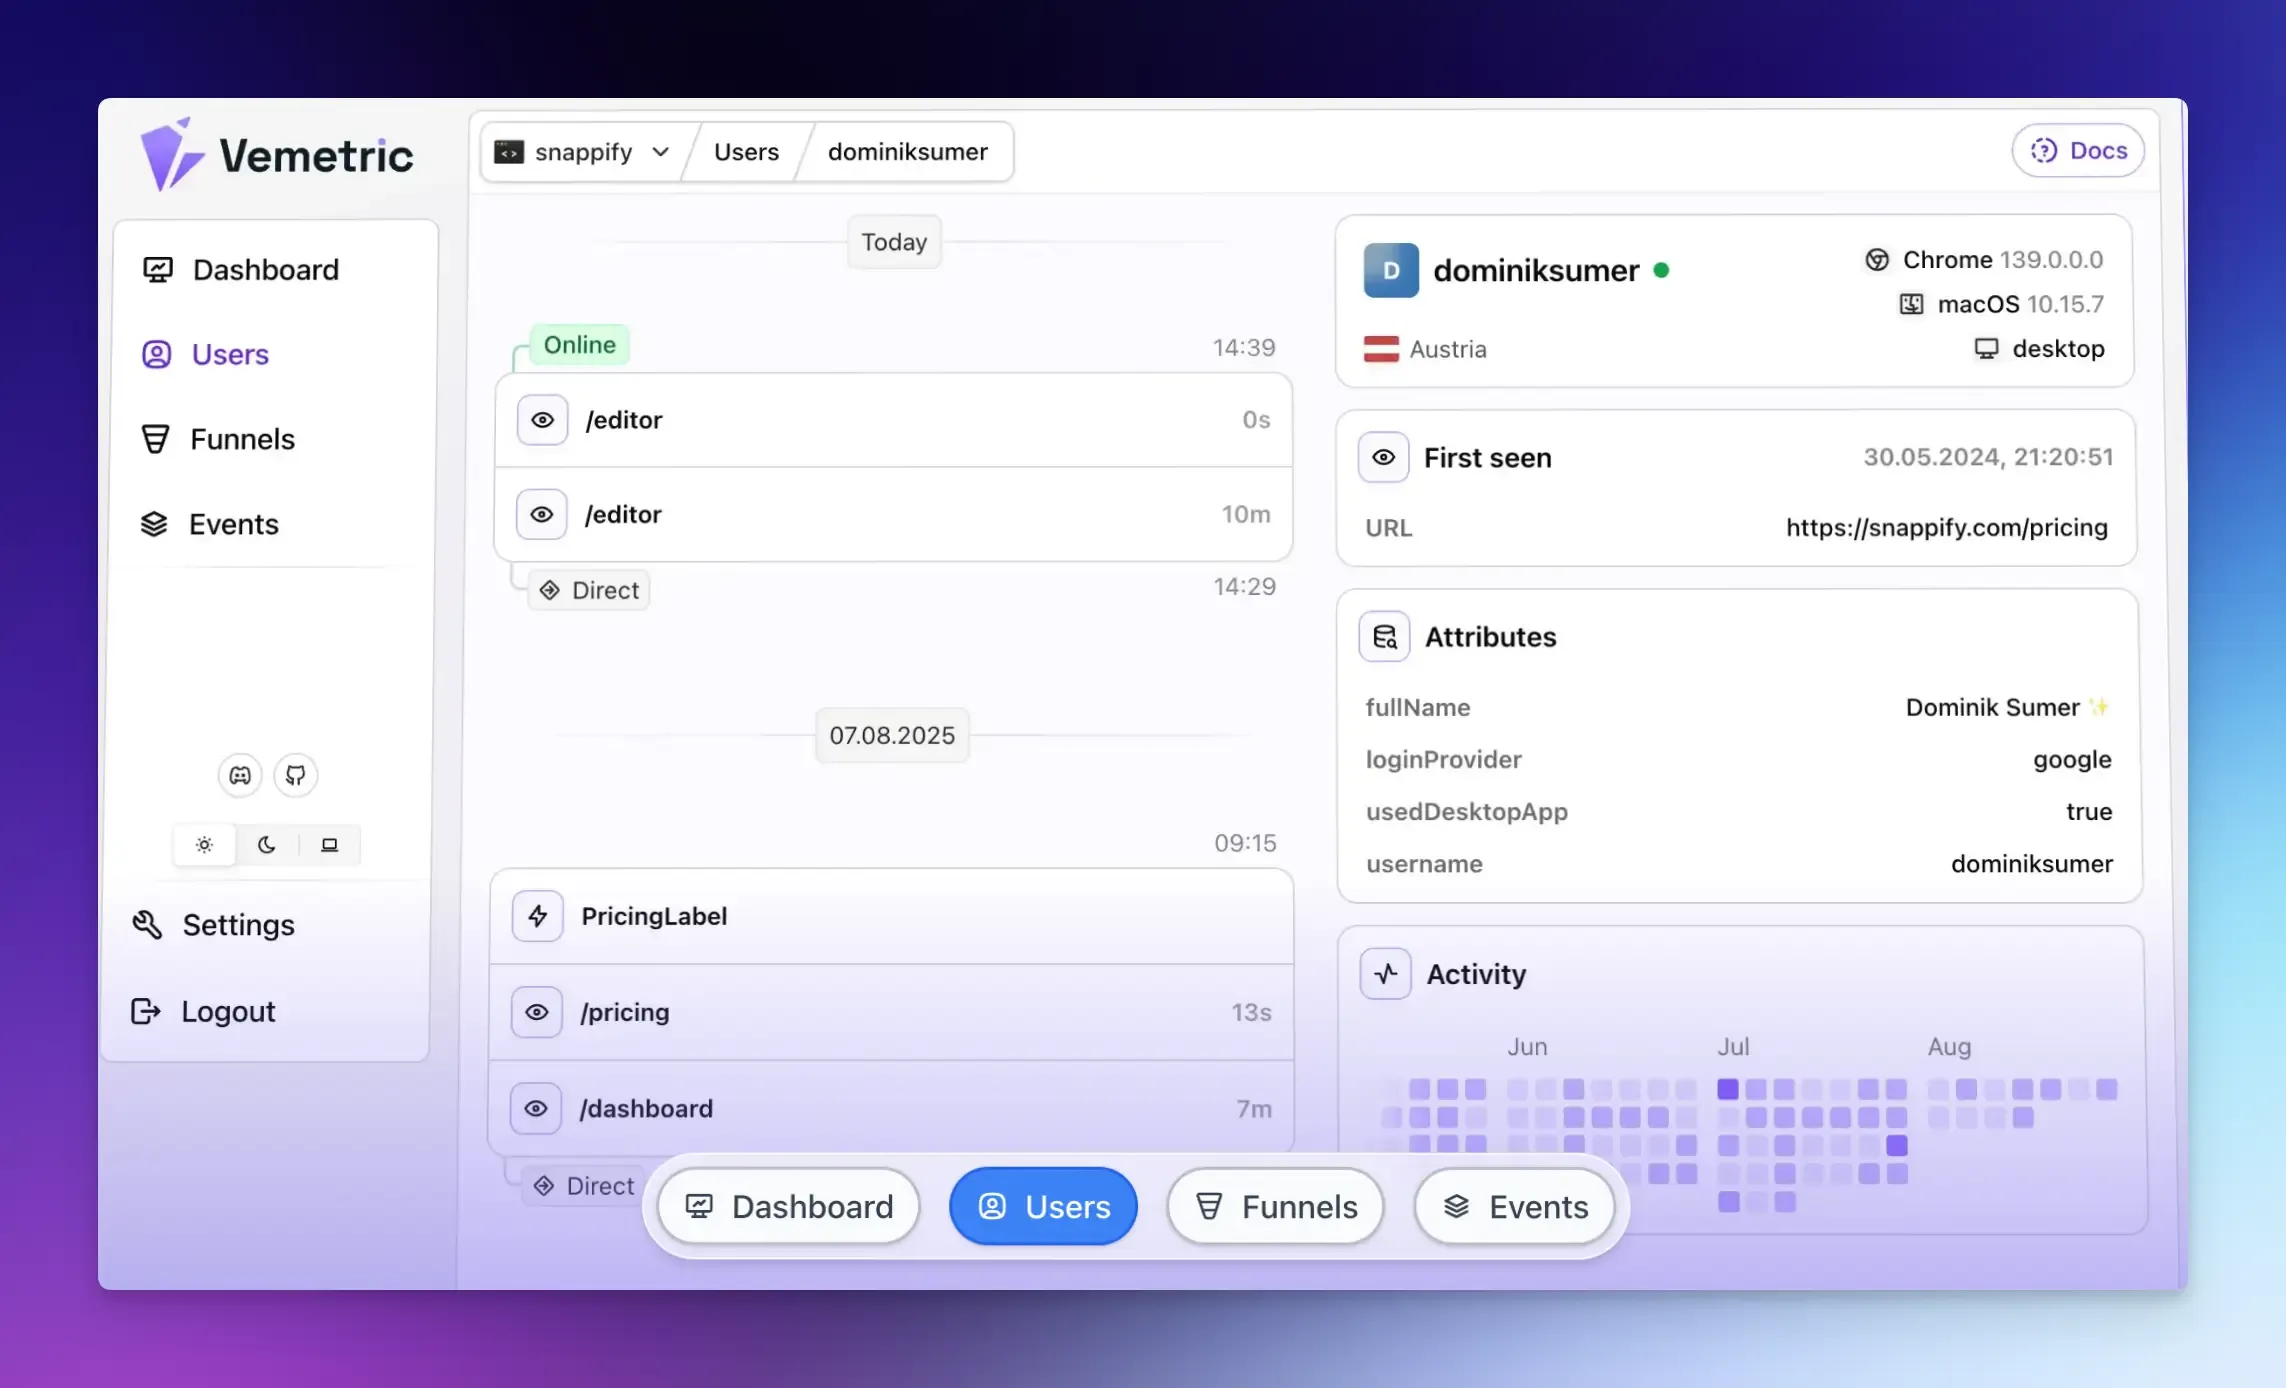
Vemetric lets SaaS teams track user behavior, monitor key engagement metrics, and identify at-risk segments early.
7 Strategies to Reduce SaaS Churn Using Product Analytics
Here are the most effective methods for taking action before a user churns.
Fix User Onboarding Using Real Behavior Data
Most churn decisions are made within the first two weeks. Onboarding is your first and best chance to prevent that from happening.
Product analytics shows you exactly where new users get stuck or drop off.
If 60% of users never complete step three of your onboarding flow, that is a retention problem hiding in plain sight.
You can use this data to simplify steps, provide in-app guidance, or trigger personalized emails at the right moment.
Vemetric funnels help you visualize onboarding flows, so you can see every step where users drop off, and test improvements with real user data.
When you optimize onboarding based on customer behavior, you directly improve early retention.
Identify and Promote High-Value Features
Not all features carry equal weight in retaining customers. Some features correlate strongly with retention, while others are used once and then forgotten.
Churn analysis lets you identify which features users never adopt and which your loyal customers regularly use.
Once you know your “sticky” features, you can build onboarding flows, tooltips, and campaigns that push new users toward those features early.
This is one of the most underrated retention strategies in SaaS.
It does not require building anything new; rather, it introduces new customers to the value your product already provides.
Another useful tactic is product launch analytics. When you release a new feature, track who uses it.
If long-term users ignore it, you built something they do not need. If only new users try it, your communication failed. Use this data to improve your product roadmap.
Vemetric’s dashboard shows usage trends over time. You can see your most viewed pages, visit duration, and user properties, helping you decide what to build or improve next.
Personalize the Customer Experience
Churn reduction through personalization is a powerful strategy, but it only works when you have the behavioral data to back it up. That is where product analytics becomes essential.
Users want to feel like your product understands their specific needs, not that they are one of thousands of accounts receiving the same email sequence.
Personalization involves using behavioral data to send the right message or experience to the right user at the right time.
Vemetric helps you easily build these behavioral segments.
You define rules like “users who visited the settings page three times but never saved changes.”
Then apply personalized actions to that group.
This feels helpful rather than promotional because it is based on what they actually do.
Segment Customers and Prioritize Retention Efforts
Different customer segments churn for different reasons.
For example, a large enterprise account may require extensive support, whereas a low-engagement free plan user might outgrow certain features.
By using product analytics, you can segment your customer base by plan type, company size, product usage frequency, and engagement depth.
This makes it easier to spot which segments are healthy and which are trending toward churn.
From there, you can allocate your resources where they matter most, design targeted campaigns for specific segments, and measure whether your efforts are actually working.
Build a Churn Risk Scoring System
Not every at-risk customer behaves the same way. Some may log in less frequently, while others may quit using the main features.
Product analytics enables you to define what a high-churn-risk user looks like using your own data. You can set criteria, such as a user not logging in for 14 days or not using a core feature for 30 days, and those accounts will be automatically flagged.
With Vemetric, you can segment users by engagement level and custom attributes, giving your customer support team a clear list of who needs immediate attention and when.
Track Key Metrics for Proactive Churn Prevention
Churn rate is a lagging metric. That means by the time it moves, customers have already left. To reduce SaaS churn, you need to measure the leading indicators that predict it.
These signals appear before the cancellation, which gives you a window to act.
- Time to First Value: How long from signup until a user experiences a real win? If this takes too long, they quit. Your goal is to shorten it.
- Feature Adoption Rate: Which features do active users love? List your top three value driving features. Track what percentage of new users try each one within the first week.
- Net Revenue Retention (NRR): Tracks how much revenue you retain from existing customers after accounting for churn, downgrades, and expansions. An NRR above 100% means your existing base is growing even if some customers leave.
- Customer Lifetime Value (CLV): The total revenue a customer generates before they churn. When CLV declines over time, it signals that churn is occurring earlier in the customer lifecycle.
- Average Revenue Per User (ARPU): When ARPU declines, it means customers are downgrading before eventually churning. Tracking ARPU trends by segment lets you see whether you’re attracting high-value customers who are less likely to leave.
- Product Engagement Score: Combine daily active users, feature usage depth, and key actions completed into a single score. Users with low engagement are at high risk of churn.
- Net Promoter Score (NPS): Measures how likely customers are to recommend your product. A declining NPS among active users is a clear sign that customer satisfaction is decreasing and churn risk is high.
Product analytics tools help you track these indicators in real time. When a leading indicator crosses a threshold, your customer success team gets notified and can take prompt action.
Close the Feedback Loop Between Data and Product Decisions
Reducing churn is not just a customer success problem. It is directly tied to your product.
If users are consistently churning because a feature is too complex or performance is poor in a specific area, the product team needs that information.
Product analytics creates a feedback loop where behavioral data guides roadmap decisions. When your product team can see which gaps are causing churn, they can prioritize fixes and improvements that have the highest retention impact.
Final Words
For most SaaS businesses, churn is predictable and can be prevented with the right data in place.
Whether you are a founder just starting to think about retention or a product leader managing a large customer base, the principles are the same.
Measure what matters, identify the patterns, act before it is too late, and improve based on what the data tells you.
Vemetric speeds up this process, giving you the data to bring your customer retention strategies to fruition.
FAQs
Monthly is the standard for most SaaS businesses. However, if you have a large customer base or short subscription cycles, tracking weekly can surface issues more quickly.
It depends on your market. For B2B SaaS targeting mid-market and enterprise customers, a monthly churn rate below 1% is considered healthy. For SMB-focused products with shorter contracts and higher volume, a 3-5% monthly rate is more typical.
Ready to understand your users?
Start tracking