Your dashboard probably has thirty metrics on it. Signups are up. Page views are up. Even your daily active users chart looks healthy.
And yet nobody on your team can answer one simple question: are we actually winning?
That gap is exactly what a North Star Metric is built to close. It’s the single number your whole company rallies around, the one that tells you, at a glance, whether customers are getting real value from your product and whether that value is turning into sustainable growth.
Here’s the catch. In a survey of employees at more than 40 successful growth-stage companies, former Airbnb growth lead Lenny Rachitsky found that roughly half default to revenue as their guiding metric, yet Airbnb, Netflix, Spotify, and Miro all deliberately avoid it as their North Star Metric. That disconnect is a big reason so many SaaS teams pick the wrong metric, then wonder why it never seems to move the business forward.
This guide covers what a North Star Metric actually is, how it’s different from a regular KPI, real examples from companies you already know, and a step-by-step framework for choosing and validating your own.
What Is a North Star Metric?
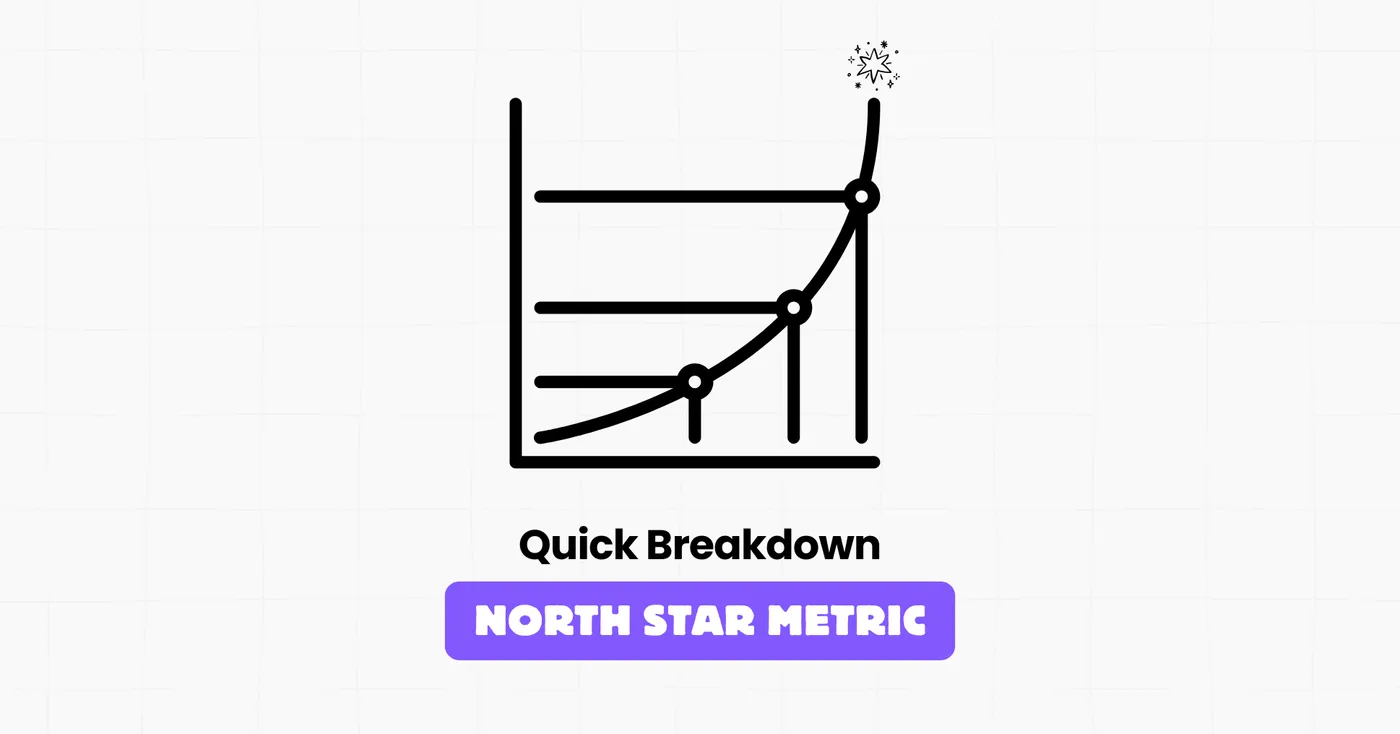
A North Star Metric (NSM) is the single metric that best represents the core value your product delivers to customers. When it goes up, your business is genuinely healthier, not just busier.
The term was coined around 2010 by Sean Ellis, the growth expert behind early growth at Dropbox, LogMeIn, and Eventbrite, who also coined “growth hacking” itself. The concept was later formalized into a full framework by product analytics company Amplitude, whose North Star Playbook is still the most widely referenced resource on the topic.
A strong North Star Metric shares a few traits, based on Amplitude’s own checklist:
- It reflects genuine customer value, not internal effort or vanity growth
- It’s a leading indicator of revenue, not a lagging one like MRR
- It sits within your product and marketing teams’ sphere of influence
- It’s simple enough that someone in support or sales could explain it in one sentence
- It’s measurable with the event tracking and analytics you already have, or can reasonably add
Notice what’s missing from that list: revenue itself.
Revenue tells you what already happened. A North Star Metric is supposed to tell you what’s about to happen.
North Star Metric vs KPI: What’s the Difference?
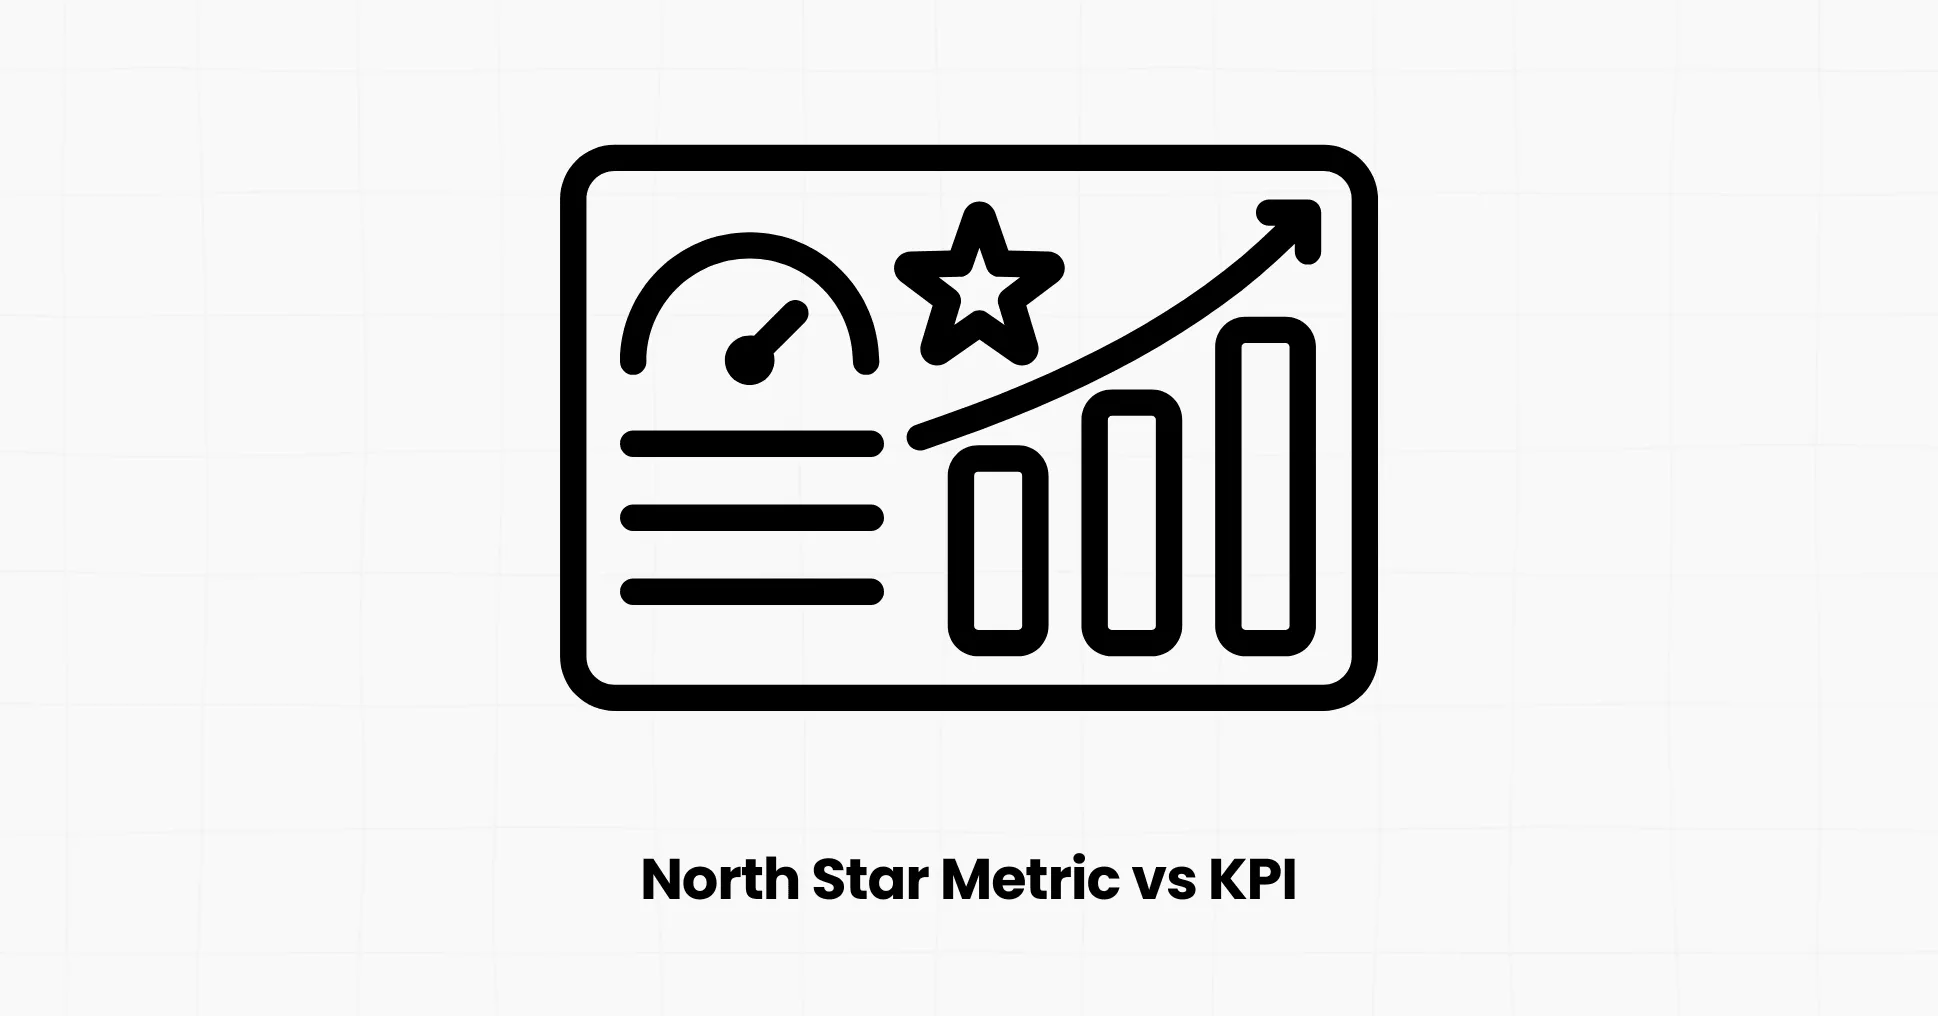
This is one of the most common points of confusion for SaaS teams, and it matters because getting it wrong leads to dashboards full of numbers with no clear priority.
North Metric:
- How many? One
- Scope: Company-Wide
- Type: Leading indicator of customer value and revenue
- Purpose: Alignment, strategy, prioritization
- Example: Weekly active teams sending 2,000+ messages
KPI:
- Many, across teams
- Team or function specific
- Can be leading or lagging
- Day-to-day operational tracking
- Onboarding completion rate, support ticket volume, checkout speed
Think of your KPIs as the individual gauges on a dashboard: fuel level, engine temperature, tire pressure.
Your North Star Metric is the compass that tells you whether you’re actually headed toward your destination. You need both, but they answer different questions.
North Star Metrics and OKRs work together the same way.
Your North Star Metric points to where the business needs to go. Your quarterly OKRs are the concrete push toward moving one of the input metrics that feeds it.
Why a North Star Metric Matters for SaaS Companies
A well-chosen NSM does a few things that scattered dashboards can’t:
- Cuts through vanity metric noise: Signups, downloads, and page views feel good but don’t tell you if customers are getting value.
- Aligns every team around one goal: Product, marketing, sales, and support can all trace their work back to the same number.
- Warns you before revenue does: Because it’s a leading indicator, a dip shows up in your NSM weeks before it hits MRR.
- Speeds up prioritization: When two features compete for a sprint, “which one moves the North Star more” is a faster call than a debate.
- Gets new hires oriented fast: One clear metric is easier to rally behind than thirty scattered ones.
North Star Metric Examples From Real Companies
Seeing how established companies define their North Star Metric makes the concept much easier to apply to your own product.
These examples come primarily from Rachitsky’s direct survey of company employees, so treat them as a snapshot rather than a permanent fact.
Companies revisit their North Star as strategy shifts, and several of the ones below have already changed theirs at least once.
- Airbnb tracks nights booked (consumption growth), chosen over revenue on purpose. Revenue was too volatile, swinging with currency rates, trip length, and host pricing, while nights booked was one step removed and much easier for teams actually to influence.
- Slack tracks the number of paid teams (customer growth).
- Netflix tracks median view hours per month (consumption growth), and has changed its North Star more than once. It started with the percentage of DVDs delivered on time, moved to the percentage of members watching 15+ minutes a month, then landed on its current metric.
- Twitch tracks five-minute plays, meaning a stream watched for five consecutive minutes or more (consumption growth).
- Miro tracks the number of collaborative boards created (engagement and virality).
- Plaid tracks bank accounts linked (consumption growth).
- HubSpot tracks weekly active users (engagement growth).
- Duolingo blends daily active users with a language proficiency score based on the CEFR standard (engagement plus user experience).
Outside of consumer tech, the same logic applies across industries.
Amplitude’s customer data shows fintech companies often use gross processing value, retail companies track items delivered on time, and travel platforms use nights or seats booked, each one chosen because it reflects value delivered rather than just activity.
How to Choose a North Star Metric for Your SaaS
Picking a North Star Metric isn’t a brainstorm you finish in an afternoon. It takes real data. Here’s a practical process.
1. Start from the customer’s job to be done:
What was the user trying to accomplish right before they got value from your product? Plaid’s job is linking a bank account. Miro’s job is collaborating remotely. For a project management tool, it might be getting a task assigned and completed with a teammate.
2. List 3 to 5 candidate metrics:
Pull from the six categories above. For a typical SaaS product, this usually narrows down to something in engagement, consumption, or customer growth.
3. Test each candidate against retention data:
This is the step most teams skip, and it’s the one that actually matters. Does the metric you’re considering predict who sticks around 30 or 90 days later? If users who hit that milestone retain significantly better than users who don’t, you’ve found a real signal, not a guess.
4. Rule out vanity and lagging metrics:
If a candidate can go up while customers get less value (like registered users or ad impressions), it’s disqualified. See the full list below.
5. Confirm it’s actionable, but not directly movable:
Your team should be able to influence it through concrete work, but not by editing a database. If you could increase your North Star Metric by flipping a switch, it’s not a real North Star.
6. Name your input metrics:
Break your NSM into 3 to 5 factors your teams can directly move. For a project management SaaS with “weekly active teams completing 3+ tasks” as its North Star, inputs might include new team signups, teams that invite a second member, template usage, and task completion rate.
7. Get company-wide buy-in, then revisit it periodically:
A North Star Metric isn’t set-and-forget. In Rachitsky’s survey, roughly a quarter of companies said their metric had recently changed or was about to.
North Star Metric Framework: Inputs, Outputs, and Guardrails
Your North Star Metric doesn’t stand alone.
It sits at the top of a small tree of input metrics that your teams actually control day to day.
Say you run a project management SaaS and land on “weekly active teams completing 3+ tasks” as your North Star. You can’t move that number directly. Instead, you would focus on the levers underneath it:
- Growing new team signups
- Getting teams to invite a second and third member
- Increasing template and workflow adoption
- Improving the percentage of assigned tasks marked complete
Each team owns a different input.
Product might own template adoption, marketing might own signups, and customer success might own multi-member activation. All of it rolls up into the same North Star.
It also helps to pair your North Star with one or two guardrail metrics, numbers that must not fall as your North Star rises.
If you’re optimizing for tasks completed, a guardrail like churn rate or support ticket volume keeps you honest, so you don’t grow the top-line number by pressuring users into busywork.
How Vemetric Helps You Track and Validate Your North Star Metric
Once you’ve picked a candidate North Star Metric, the real work starts: proving it actually predicts retention, and watching it move in real time.
That’s where a lot of teams get stuck. Spreadsheets and generic web analytics can tell you traffic went up. Still, they can’t tell you whether the specific action you believe matters, like a team completing its third task or a user connecting a data source, is the one that keeps people around.
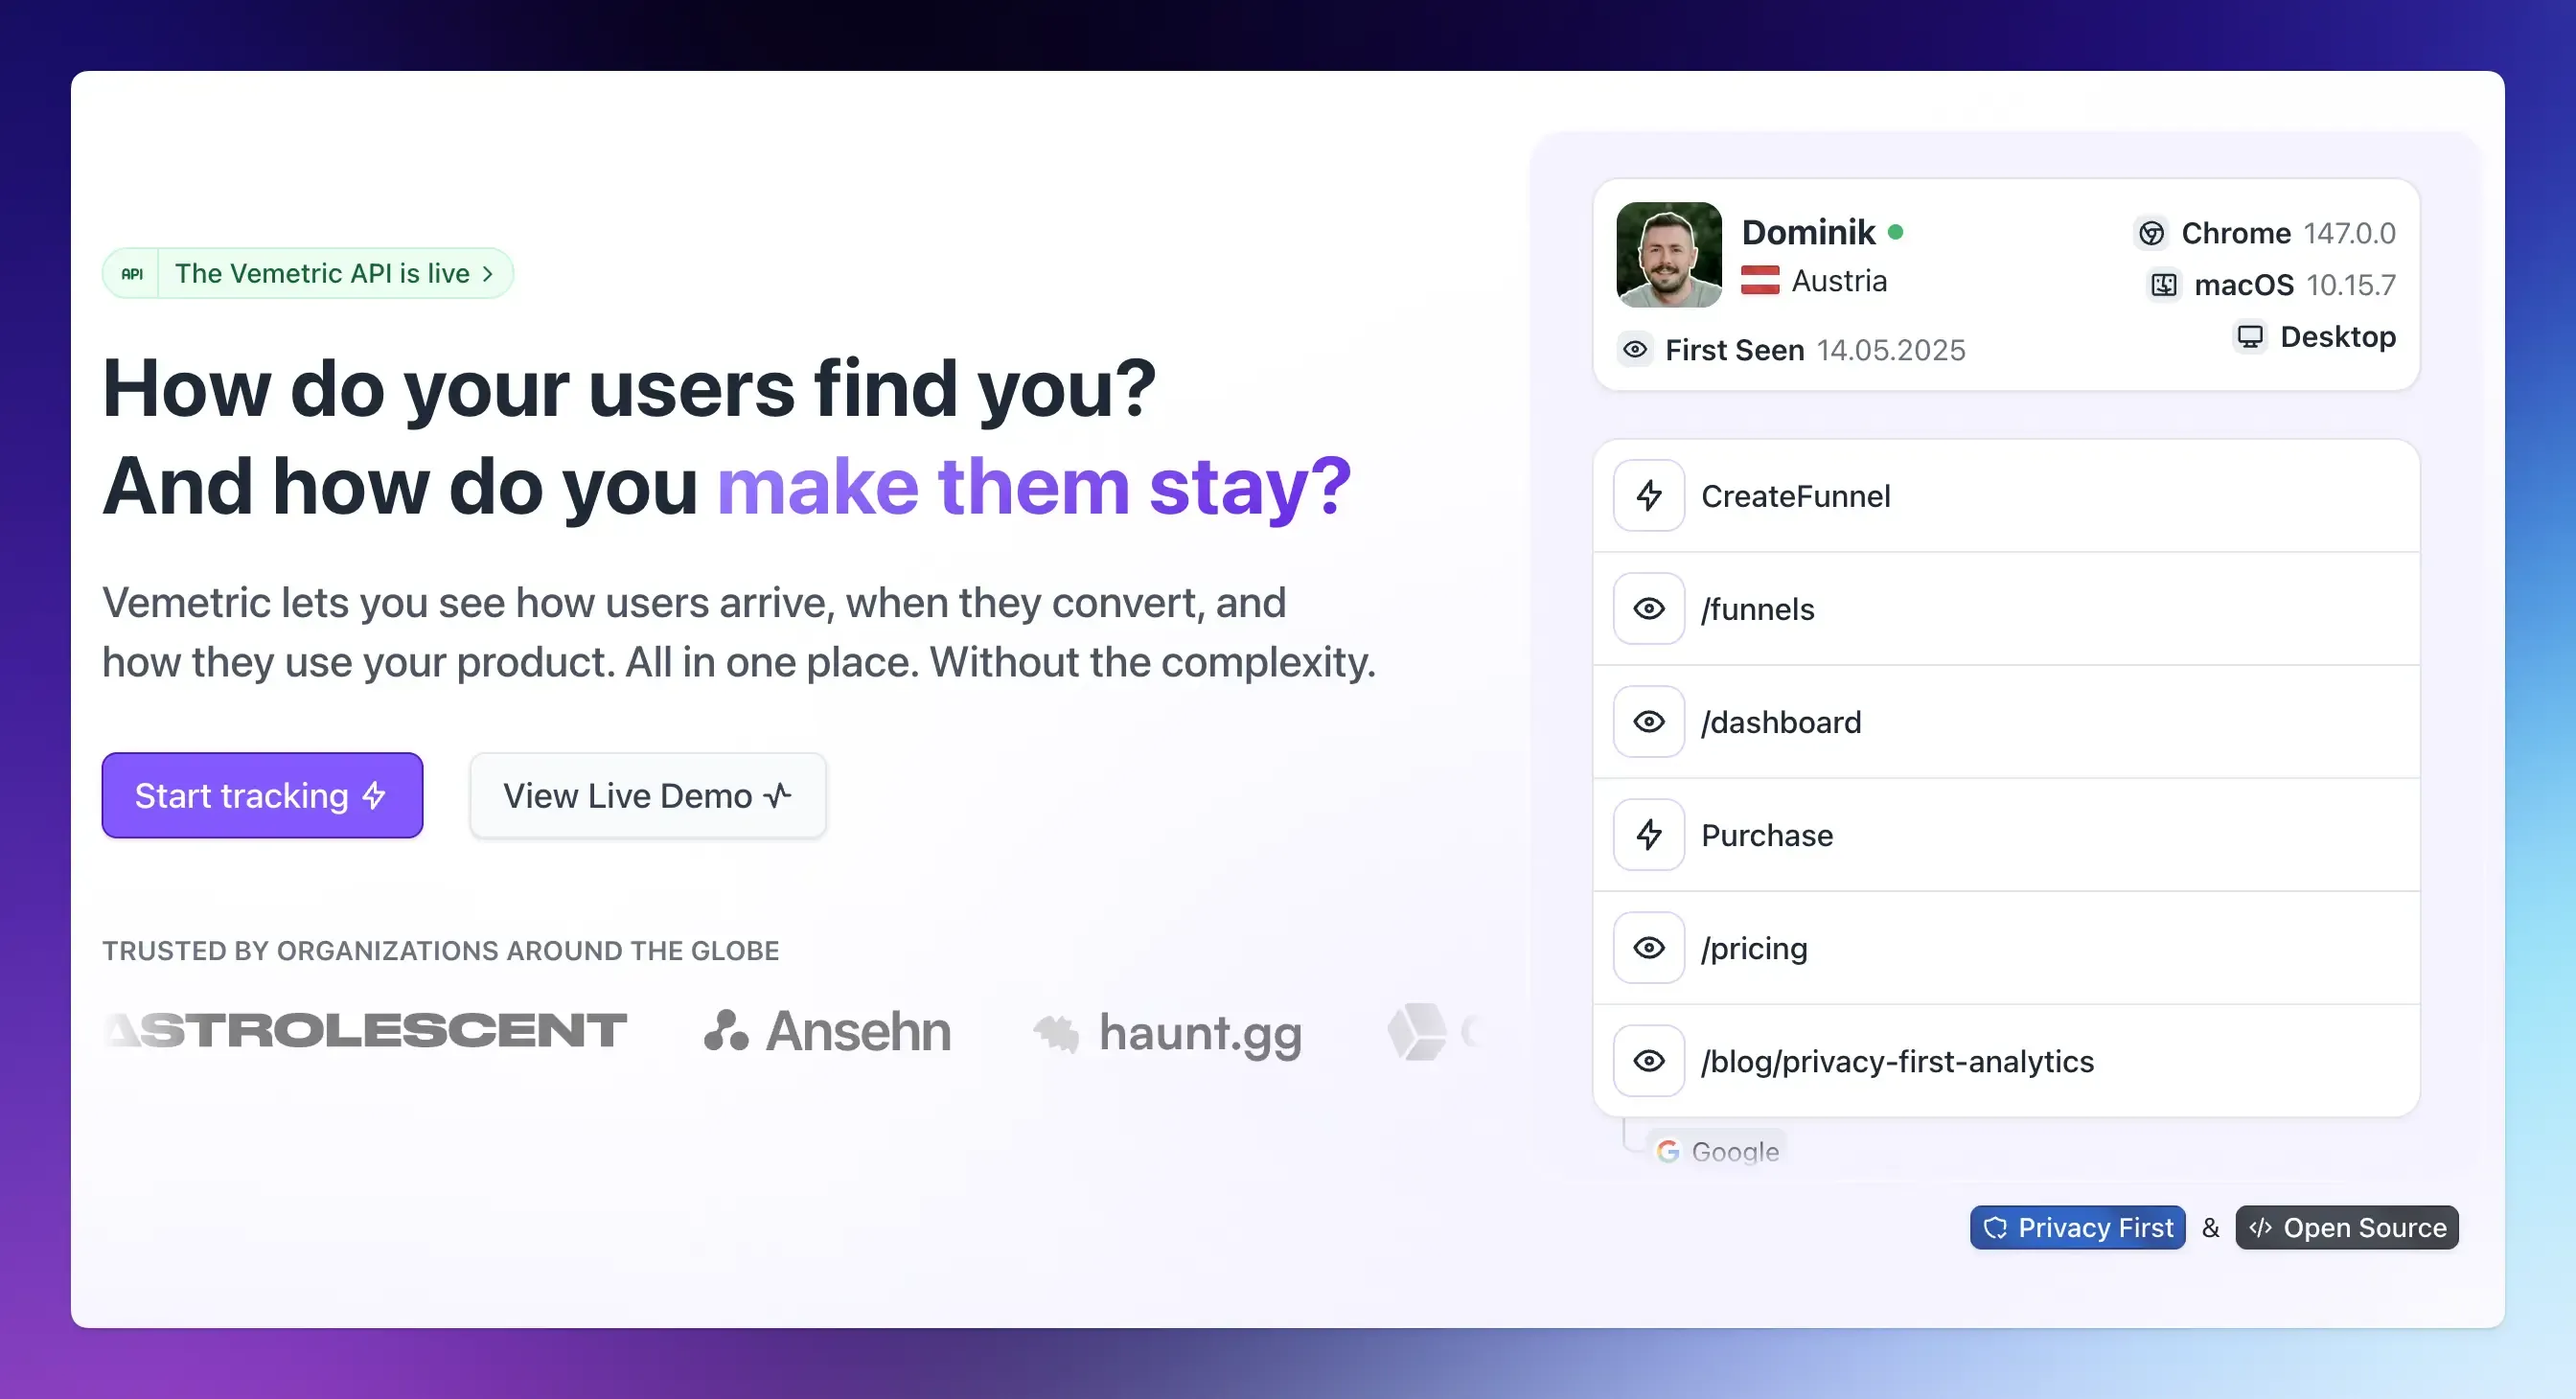
Vemetric gives you the pieces actually to do this:
- Custom event tracking so that you can instrument your candidate North Star Metric as a real, trackable event instead of a guess
- Funnels, so you can map the path from signup to your North Star event and see exactly where users drop off.
- Individual user journeys so that you can see, session by session, what your best users did differently from the ones who churned
- Event streams, so you can watch your North Star Metric happening in real time, not just in a weekly report
Vemetric is also cookie-free by default, GDPR-compliant with servers in the EU, and open source, so you can verify exactly how your data is handled. You can start tracking for free on projects under 2,500 events a month, with paid plans starting at $5 a month once you outgrow it.
FAQs
No, and this is intentional. A North Star Metric is meant to give the company one clear focus.
Not usually. MRR and ARR are lagging indicators. They tell you what already happened rather than predicting what’s coming next, and optimizing directly for revenue can push teams toward pricing tricks instead of real product improvements.