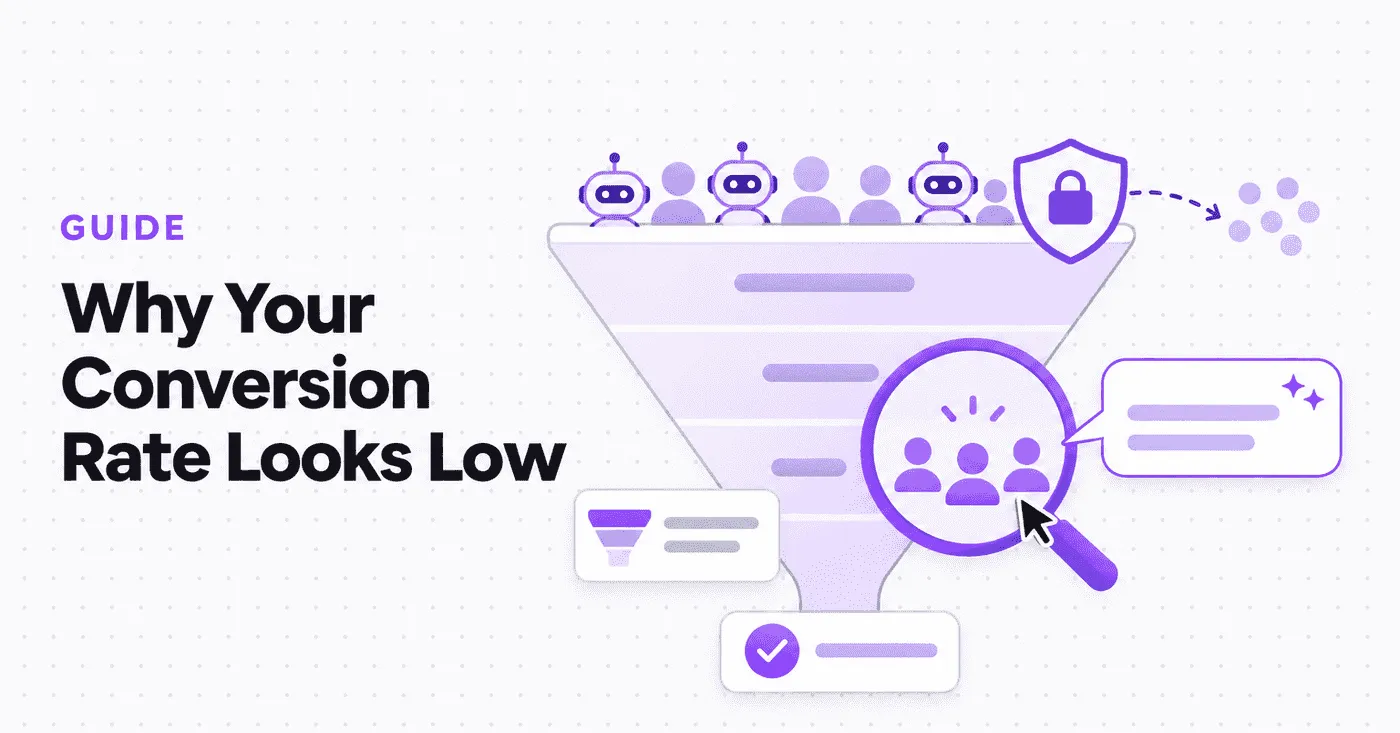
Your dashboard says 1.8% of visitors converted last month. Your database says you got more new customers than that rate could produce. One of those numbers is wrong, and it is usually the analytics.
When your conversion rate looks worse than actual performance, the cause is rarely a broken funnel.
It is untracked traffic: real people and real conversions your analytics never saw, mixed with fake or duplicated visitors it counted when it should not have.
This guide explains why that happens, how to estimate your real conversion rate vs reported, and what to change in your tracking so the number stops underselling your work.
Why Your Conversion Rate Can Look Worse Than It Really Is
Your reported conversion rate looks worse than your actual rate when your analytics misses conversions more often than it misses visitors, or counts visitors who could never convert.
Conversion rate is a simple fraction: conversions divided by visitors. If your tracking lost 20% of visitors and 20% of conversions evenly, the rate would stay correct.
You would just see smaller numbers on both sides.
The problem is that data loss is rarely even. Some things shrink the top of the fraction (conversions), and other things inflate the bottom (visitors). Both push the rate down.
Here is an illustrative example. Say your real numbers for a month are 10,000 human visitors and 300 signups, a 3.0% conversion rate. Now apply four common blind spots:
- Ad blockers hide 2,500 visitors, and because those visitors tend to be high-intent, they take 100 signups with them.
- 30 signups happen on a page your script never sees, such as a payment redirect the user closes too early.
- 1,500 bot visits get counted as real traffic.
- 500 returning visitors get counted twice because they came back on a different day or device.
Your dashboard now shows 9,500 visitors and 170 signups.
That is a 1.8% conversion rate, against a real 3.0%. None of these numbers come from a real company, but every mechanism behind them is real, and each one is covered below.
5 Analytics Blind Spots That Drag Your Conversion Rate Down
Each of these blind spots either hides conversions or adds visitors who will never convert. Most sites have at least three of them at once.
1. Ad blockers hide visitors, and often your best-fit ones
Ad blocking is not a niche habit anymore. According to eyeo’s 2026 Ad-Blocking Report, about 1.1 billion people used an ad blocker in Q4 2025, roughly 30% of the internet population. The same report notes that these tools block analytics trackers as well as ads.
If blocked visitors behaved exactly like everyone else, losing them would not change your rate. They do not.
GWI data cited in the eyeo report shows ad-block users skew toward higher education, higher income, and higher purchase intent in categories like technology. They are also more likely to create accounts and start subscriptions.
So the visitors you lose are disproportionately the ones who convert.
That is how ad blockers create hidden conversions: the signups still land in your database, but the analytics never connects them to a visit.
If you sell to developers or other technical buyers, expect this effect to be stronger than the global average, since that audience is quick to install blockers and privacy browsers.
2. Conversions that happen where your script cannot see them
A lot of conversions finish outside the page where your tracking script runs. Common examples:
- Hosted checkout redirects: The user pays on a payment provider’s page, then closes the tab before your thank-you page loads. The payment happened. The conversion event never fired.
- Email confirmations: The user signs up on desktop and confirms on their phone. Your analytics sees a half-finished signup on one device and an unrelated visit on another.
- The app lives on another subdomain: The marketing site is tracked, but app.yourdomain.com is not, or it reports to a separate project. Activation and upgrades happen in a place your funnel cannot see.
- Events fired right before navigation: A click event sent just as the browser leaves the page can be cut off before the request completes.
These gaps only affect the top of the funnel, which is why they make your conversion rate look worse than it actually is rather than just smaller.
3. Cookieless counting and device switching inflate your visitor count
Privacy-friendly analytics tools often recognize visitors without cookies. A common method is a hash built from the IP address and user agent with a salt that rotates daily. Vemetric works this way by default, as its user identification docs explain: an anonymous visitor counts as new the next day.
That is a reasonable privacy trade-off, but it affects the denominator.
Someone who reads your pricing page on Monday and signs up on Thursday can count as two visitors and one conversion.
The same happens when one person browses on a work laptop and later on their phone.
For products with a consideration period of several days, this can noticeably inflate visitor counts over a 30-day window.
Cookie-based tools are not immune either. People clear cookies, use private windows, and switch devices too.
4. Bots padding the denominator
Automated traffic is now a large share of the web. The 2025 Imperva Bad Bot Report found that automated traffic made up 51% of all web traffic in 2024; for the first time in a decade, it surpassed human activity.
Many bots never run JavaScript, so they never reach your analytics.
But headless browsers, scrapers, and some AI agents do execute scripts.
Every one of those visits counts toward your visitor total, and none of them convert.
Typical signs of bot traffic in your reports:
- Sudden spikes from one country, browser version, or referrer.
- Very short visits to a single page with no further interaction.
- Traffic at steady, machine-like intervals around the clock.
5. Safari limits and consent choices that split one journey into several
Safari’s Intelligent Tracking Prevention caps cookies set through JavaScript at seven days, a rule WebKit introduced in ITP 2.1 and later extended to other script-writable storage. A visitor who returns after a week can look like a brand new person.
This mainly distorts conversion rates by channel.
The original paid or organic visit gets no credit, and the conversion shows up under direct traffic. Your best channels look weaker than they are, and “direct” looks suspiciously strong.
Consent banners add a similar gap for cookie-based tools.
Visitors who decline cookies may not be tracked at all, or only partly.
If you are unsure whether you even need a banner, Vemetric’s guide on whether you need a cookie consent banner walks through the questions.
The Common Mistake: Mixing Data Sources
Once teams notice the gap, many try a quick fix: take signups from the database and divide them by visitors from analytics. That swaps one error for another.
Your database catches every signup, including the ones from ad-block users. Your analytics still misses those same users on the visitor side. The result usually overstates your conversion rate, because the top of the fraction is complete and the bottom is not.
The opposite mistake happens too. Dividing analytics conversions by server log visits (which include bots and crawlers) makes the rate look far worse than reality.
Two rules keep the comparison honest:
- Use the same unit on both sides: A rate based on sessions will always be lower than one based on unique users, because one person can have many sessions before converting. Pick one and stick with it.
- Treat mixed-source numbers as bounds, not answers: They are useful for building a range, which is exactly what the audit below does.
How to Estimate Your Real Conversion Rate
You will not get a perfect number. You can get a reliable range in about an hour, using data you already have.
- Pick one conversion and one closed window: For example, paid signups in the last full calendar month. Use the same timezone in every tool.
- Get the ground truth count: Pull the number of conversions from your database or billing system. Say it is 200.
- Get the tracked count: Pull the same conversion count from your analytics for the same window. Say it shows 170.
- Calculate your conversion capture rate: Divide tracked by actual: 170 / 200 = 85%. Your analytics misses about 15% of conversions. This single number is the most useful output of the audit.
- Find out who is missing: If your backend stores the user agent or signup source at registration, compare that list with the conversions your analytics recorded. Missing conversions that cluster around Firefox, Brave, or Safari, or around one checkout path, tell you where the leak is.
- Check the visitor side for noise: Look for the bot patterns listed above and segment them out. Then note your typical time to convert. If most buyers take several days, cookieless or cross-device counting is likely inflating visitors.
- Build the range: Your reported rate (170 tracked conversions over tracked visitors) is usually the floor. Database conversions over tracked visitors, after removing obvious bot traffic, is usually the ceiling. Your real conversion rate almost always sits between the two.
If the floor and the ceiling are far apart, your tracking needs work before the rate is useful for decisions. If they are close, you can trust your trends and move on.
How to Close the Gap Between Real and Reported Conversions
The goal is not to track everyone at any cost. It is to make sure the conversions that already happened show up in your reports, and that the visitor count reflects real people.
Send revenue conversions from your server
This is the highest-impact fix. When a signup, payment, or upgrade is recorded by your backend and sent to analytics from there, browser blockers and closed tabs cannot stop it. The browser is not involved.
Keep your frontend script for page views and discovery, and move the events tied to revenue to the server. Vemetric’s post on server-side tracking vs ad blockers covers this hybrid setup in more depth.
Serve tracking from your own domain
Many blockers filter requests by known third-party analytics domains. Routing the script and the data through a subdomain you own makes those requests look like the rest of your site’s traffic.
Vemetric’s proxy guide has ready setups for Next.js, Vercel, Nginx, and Cloudflare.
Use a neutral name like hub.yourdomain.com, not analytics.yourdomain.com, since blockers flag obvious tracking names.
A proxy improves your odds but does not guarantee anything, and it does not change what you collect or your privacy obligations.
Identify users when they sign up or log in
Identification links anonymous activity to a known account.
In Vemetric, calling identify with your database user ID merges the visitor’s earlier anonymous session into their profile, so a journey from blog post to pricing page to signup sits on one timeline. Call resetUser on logout so the next person on that device is not merged in.
This matters for the denominator too.
A logged-in user who returns on a new day or a new device is still one person, not a fresh anonymous visitor.
Track your marketing site and app as one project
If your app lives on a subdomain, put it in the same project as your website. Vemetric’s guide to tracking across subdomains comes down to two steps: set the project to your base domain, and use the same project token on every subdomain. Your funnel can then run from the first landing page to activation inside the product.
Use cookies only where visitors have agreed
If your audience has a long consideration period and you collect consent anyway, cookies help recognize returning visitors. Vemetric is cookieless by default, but you can set allowCookies after consent, which lets it recognize returning visitors for up to 13 months instead of one day.
Watch your visitor numbers for bot traffic
No analytics tool catches every bot. Use filters to isolate suspicious traffic by country, browser, or referrer, save those filters, and exclude them when you calculate conversion rates. Recheck after any sudden traffic spike.
What to Do With Your Corrected Conversion Rate
A better number only helps if it changes how you report and decide.
- Report the capture rate next to the conversion rate: “2.1% conversion rate, 85% of conversions tracked” tells your team far more than the rate alone.
- Annotate tracking changes: Adding a proxy or server-side events will make conversions jump overnight. Note the date, or someone will credit it to the latest landing page tweak.
- Compare benchmarks with care: Published benchmarks are measured with their own blind spots, so a gap between your rate and an industry average may be a tracking difference, not a performance one. Vemetric’s post on free trial to paid conversion rate shows how usage data gives you a sturdier baseline.
- Judge channels on confirmed conversions: When attribution is shaky, tie each channel to conversions your backend can confirm. The guide on proving marketing ROI in SaaS covers this in detail.
- Rerun the audit regularly: Browsers, blockers, and your own site all change. A quarterly check, plus one after any checkout or signup change, keeps the gap from quietly reopening.
The short version: your funnel may be performing better than your dashboard suggests. Before you redesign a page or cut a channel, check how much of the story your analytics can actually see.
FAQs
It depends on your audience. Eyeo estimates about 30% of internet users run an ad blocker, and technical audiences often run them more. The only reliable way to know your own impact is to compare tracked conversions with backend conversions for the same window.
Many cookieless tools identify anonymous visitors with a daily rotating hash, so a person who returns on another day counts as a new visitor. Identifying users at signup and login, or enabling cookies after consent, reduces this effect.