
7 Best Sentry Alternatives in 2026
Choosing the right tool to track errors and monitor performance can make a big difference in how smoothly your projects run.
Sentry dominates this field for good reason. It arrived early, added integrations, and now tracks everything from front‑end JavaScript to backend Rust.
But here is the question teams ask today: Do you need all of that?
Maybe you want similar reliability without complex setup, a more generous free tier, or a tool that combines error tracking with product analytics for deeper context.
If you are considering alternatives, this guide is for you.
We compare the best Sentry Alternatives, focusing on each tool’s main strengths, who it is good for, and what you should think about when choosing.
You will find tools that fit simple use cases as well as more advanced ones for teams that need extra detail.
Let’s get started.
Why You Should Look for Sentry Alternatives?
Despite its strong core features, many teams consider other tools for specific needs.
Pricing:
Sentry charges for every error occurrence. An event is any crash, a slow transaction, or any log you send to them.
Event-based pricing sounds fair until a single bug happens 50,000 times and you’re billed 50,000 times.
Good alternatives charge per seat, per month, with clear caps. Some offer flat-rate tiers that include a reasonable volume of errors.
Limited Scope:
Sentry focuses mainly on error tracking and alerts. It does some performance monitoring, but it doesn’t provide deep logs, infrastructure metrics, or full stack traces without adding other tools.
Complexity:
Sentry’s user interface prioritizes breadth over speed. It shows you twenty different charts and metrics on the main dashboard. This makes it hard to see the crashes that haven’t been fixed.
Large systems with many services can require extensive configuration to generate useful insights, and the learning curve can slow teams seeking quick results.
Data Migration:
Sentry locks your historical data behind active subscriptions. If you stop paying, you lose access to all past crash reports. You cannot export your own error data in bulk without writing custom scripts.
Performance:
Sentry may not always show new errors in real time, particularly during heavy traffic or during large events.
Top 7 Alternatives to Sentry
Now that you know what to look for in a good Sentry alternative, here are some options worth considering.
Datadog
Datadog is a cloud monitoring and full-stack observability platform that goes beyond simple error tracking, helping you monitor the entire production environment.
Its comprehensive coverage makes it a strong alternative to Sentry for teams that want error tracking linked to infrastructure metrics, apps, logs, and user sessions.
Best for: Medium-to-large companies with complex, distributed applications.
Key features:
- Application performance monitoring (APM) with distributed tracing.
- Log management with powerful search.
- Real user monitoring to capture actual customer interactions.
- Security monitoring and AI anomaly detection.
- Feature flags with automated rollbacks and stale flag detection.
Pros:
- Strong signal correlation between errors and performance issues.
- Handles massive data volumes.
- Hundreds of supported tools and platforms.
Cons:
- Costs can grow quickly as you add modules.
- No self-hosted option.
Pricing: Free plan available. Pro plan costs $15 per host per month, billed annually.
New Relic
New Relic is an all-in-one observability platform that delivers deep code-level visibility.
Like Datadog, it is much more than an error tracker.
It provides a unified interface for visualizing key metrics, events, logs, and traces across your entire tech stack. It also supports open standards such as OpenTelemetry and Prometheus, so you are not locked into proprietary agents.
However, if you only need error tracking, you are paying for a platform that does ninety things you will never touch.
Best for: Developers and engineering teams that want flexibility, detailed transaction tracing, and code-level diagnostics.
Key features:
- Full-stack APM with distributed tracing.
- Browser and mobile monitoring with synthetic checks.
- Infrastructure monitoring covers Kubernetes and cloud hosts.
- Real user monitoring and dashboards.
- New Relic Query Language (NRQL) lets you query custom data.
Pros:
- Wide coverage from one dashboard.
- Generous free tier and cheaper than per-host models.
Cons:
- It takes time to learn NRQL and navigate the interface.
- Usage-based pricing can spike with unexpected traffic.
Pricing: Free tier includes 100 GB of ingest per month. Paid plans start at a monthly rate per user and per GB.
Rollbar
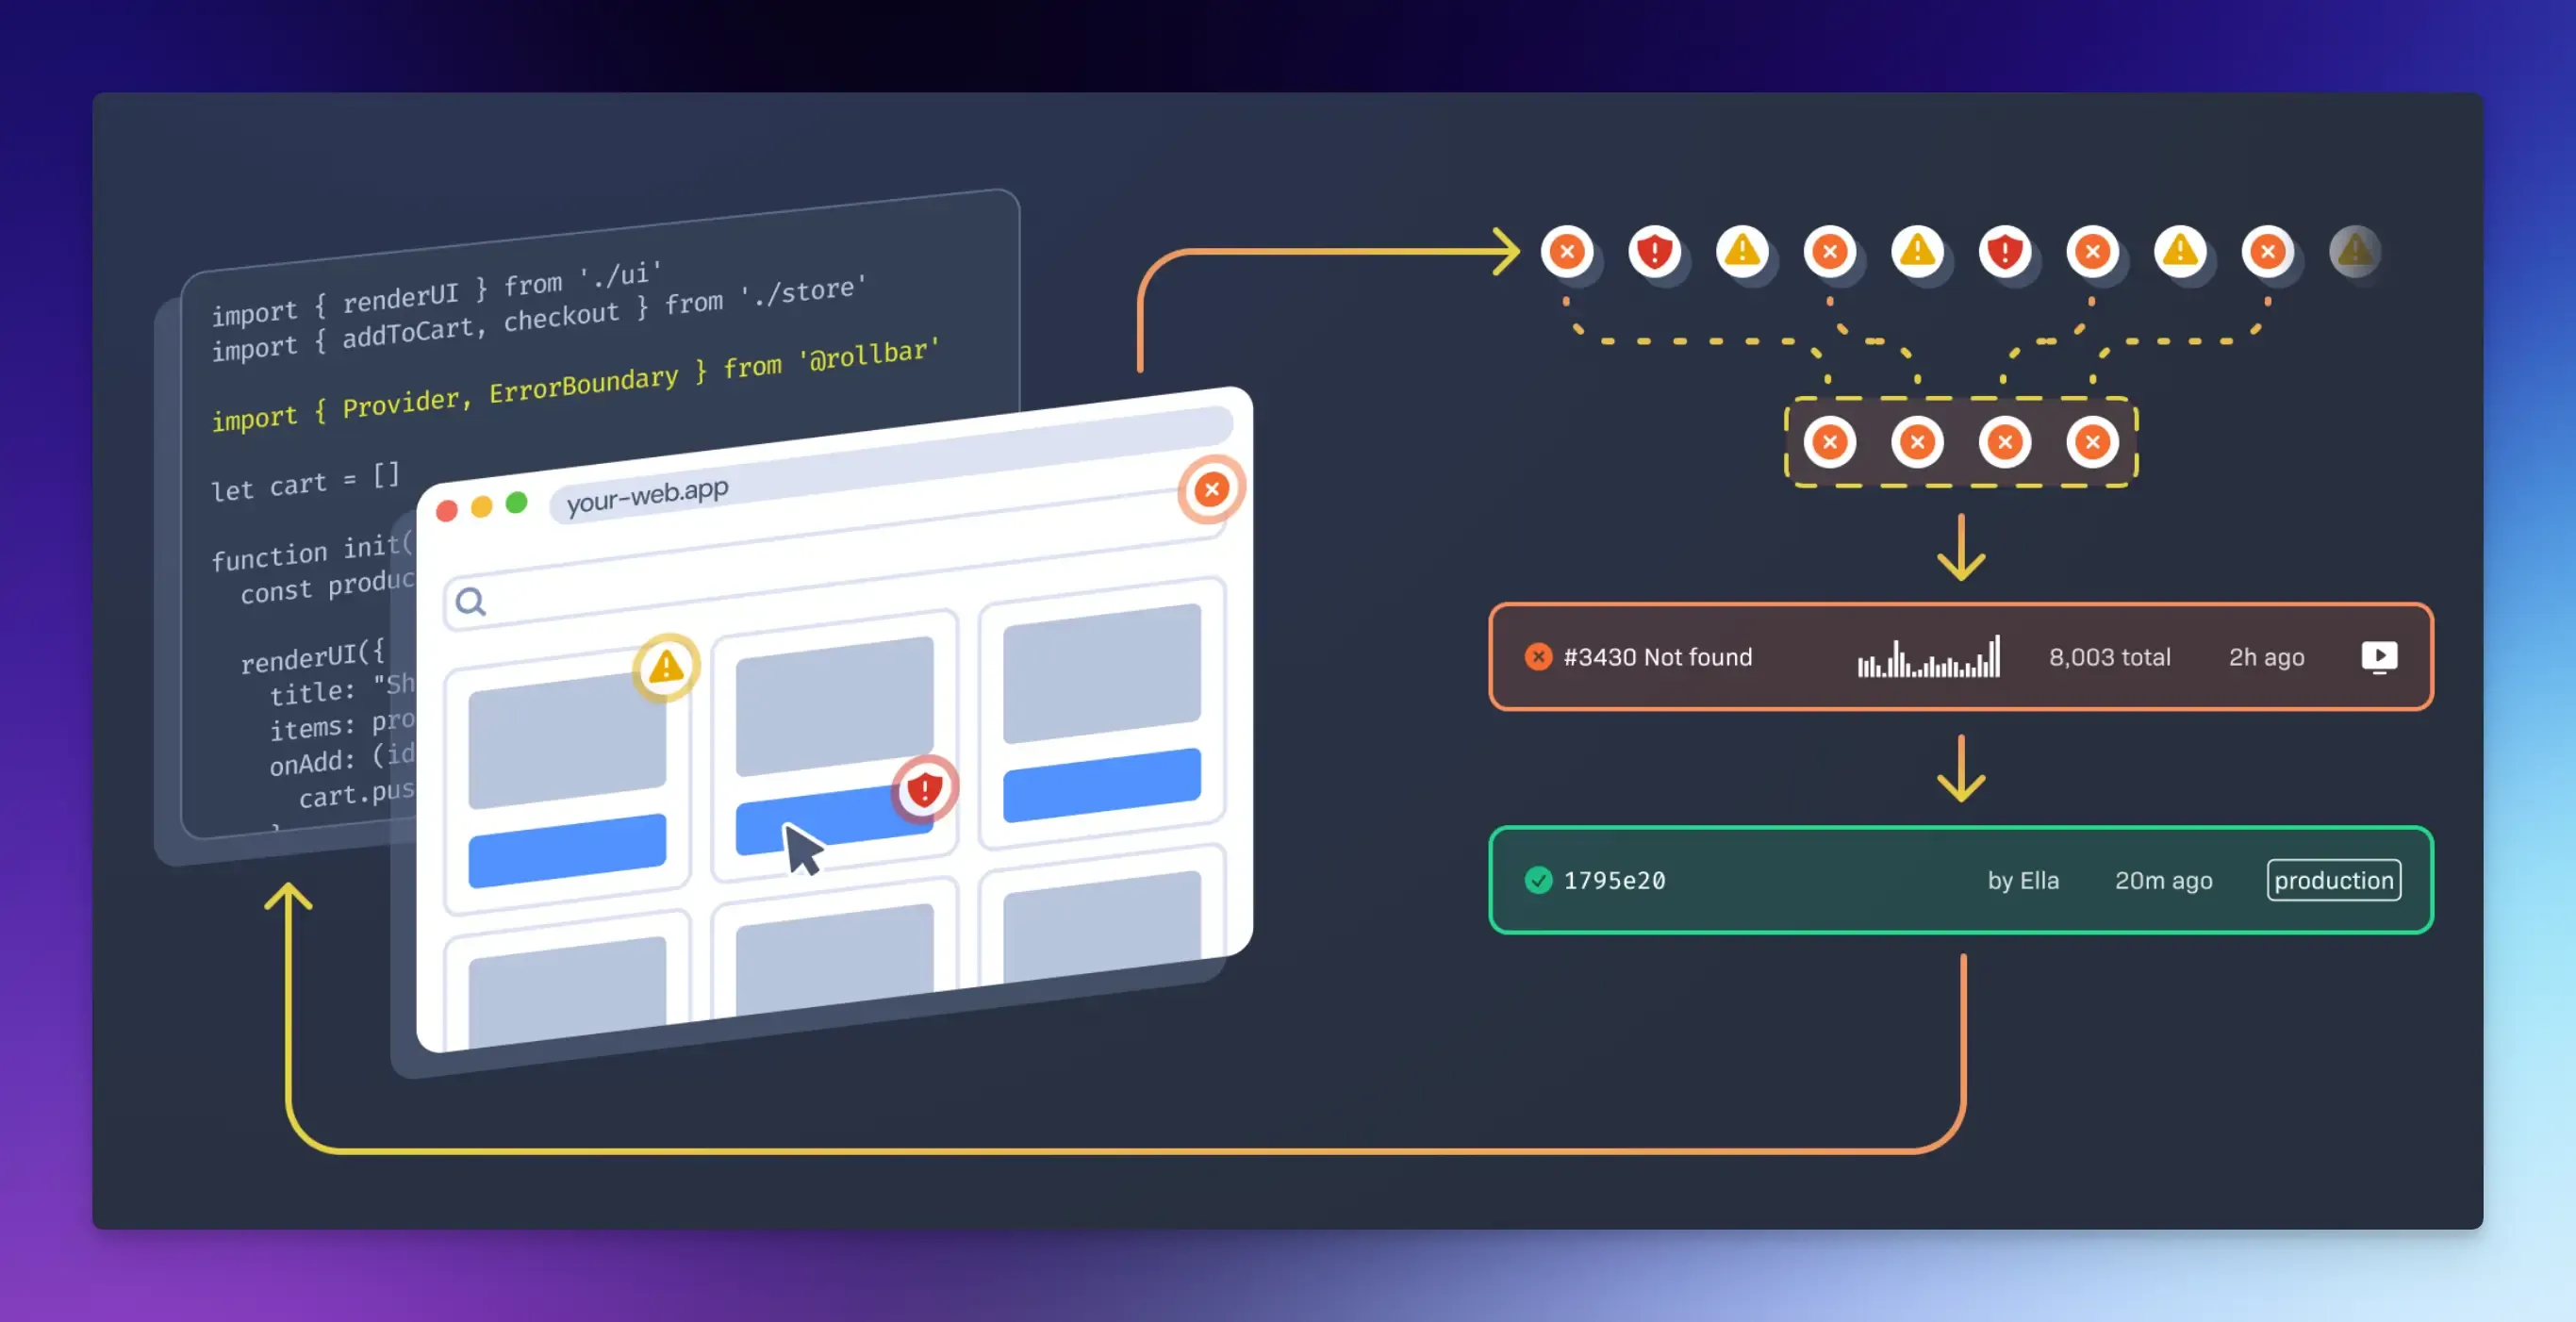
Rollbar is an error-monitoring platform that not only catches errors in your applications but also automatically fixes them.
It includes performance monitoring, AI-assisted workflows, and powerful telemetry-driven analytics, providing detailed stack traces and user action data to help developers figure out what went wrong.
Best for: QA, DevOps, and engineering teams that want to automate error detection and resolution.
Key features:
- Error monitoring with full context.
- Automatic error grouping and session replays.
- Real-time alerts across projects.
- Resolve AI agent for intelligent code reviews.
- Rollbar Query Language lets you search and analyze your error data.
Pros:
- Easy to integrate with multiple languages.
- Real-time visibility and rich debugging context.
Cons:
- Automatic grouping may not work perfectly for everyone.
- Search and query performance can be slow.
Pricing: Free plan includes 5,000 events per month. Paid plans start around $15.83 per month and scale based on event volume.
Dynatrace
Dynatrace is an AI-powered observability platform built for large enterprises with complex systems.
It is a good Sentry alternative if you want error tracking plus everything else, but you do not want to build it yourself.
It automatically maps your entire application, including services, containers, dependencies, and databases, without configuration files or SDKs.
Best for: Large enterprises and teams that want AI-powered diagnosis and have a budget for premium automation.
Key features:
- Full-stack monitoring across applications, microservices, hosts, networks, and cloud platforms.
- Davis AI provides automated root cause analysis.
- Automatic instrumentation, service maps, and dependency visualization.
- Real user monitoring across mobile, hybrid, and single-page apps.
- Log management and analytics.
Pros:
- Easy implementation with minimal configuration.
- Highly useful AI root cause analysis.
Cons:
- Full-stack monitoring can be expensive at scale.
- Overkill if all you need is basic error tracking.
Pricing: Full-stack monitoring costs $0.08 per hour for an 8 GiB host, or approximately $58 per month.
Splunk Observability Cloud
Splunk built its reputation on log management, but its observability cloud solves the one problem that keeps engineering leads awake: missing errors.
It combines real-time streaming analytics, infrastructure monitoring, application performance tracking, and security observability into one unified platform.
Best for: Enterprises and DevOps teams that need full data visibility without sampling.
Key features:
- NoSample tracing captures every transaction without sampling.
- Business impact analysis connects technical issues to revenue and conversion data.
- Application performance, database, and real user monitoring.
- OpenTelemetry support prevents vendor lock-in.
- Deep integration with the Splunk ecosystem.
Pros:
- Comprehensive monitoring at scale.
- Superior stability and speed.
Cons:
- It can be more expensive than simpler tools.
- Customization can be limited.
Pricing: Costs $15 per host per month, billed annually.
SigNoz
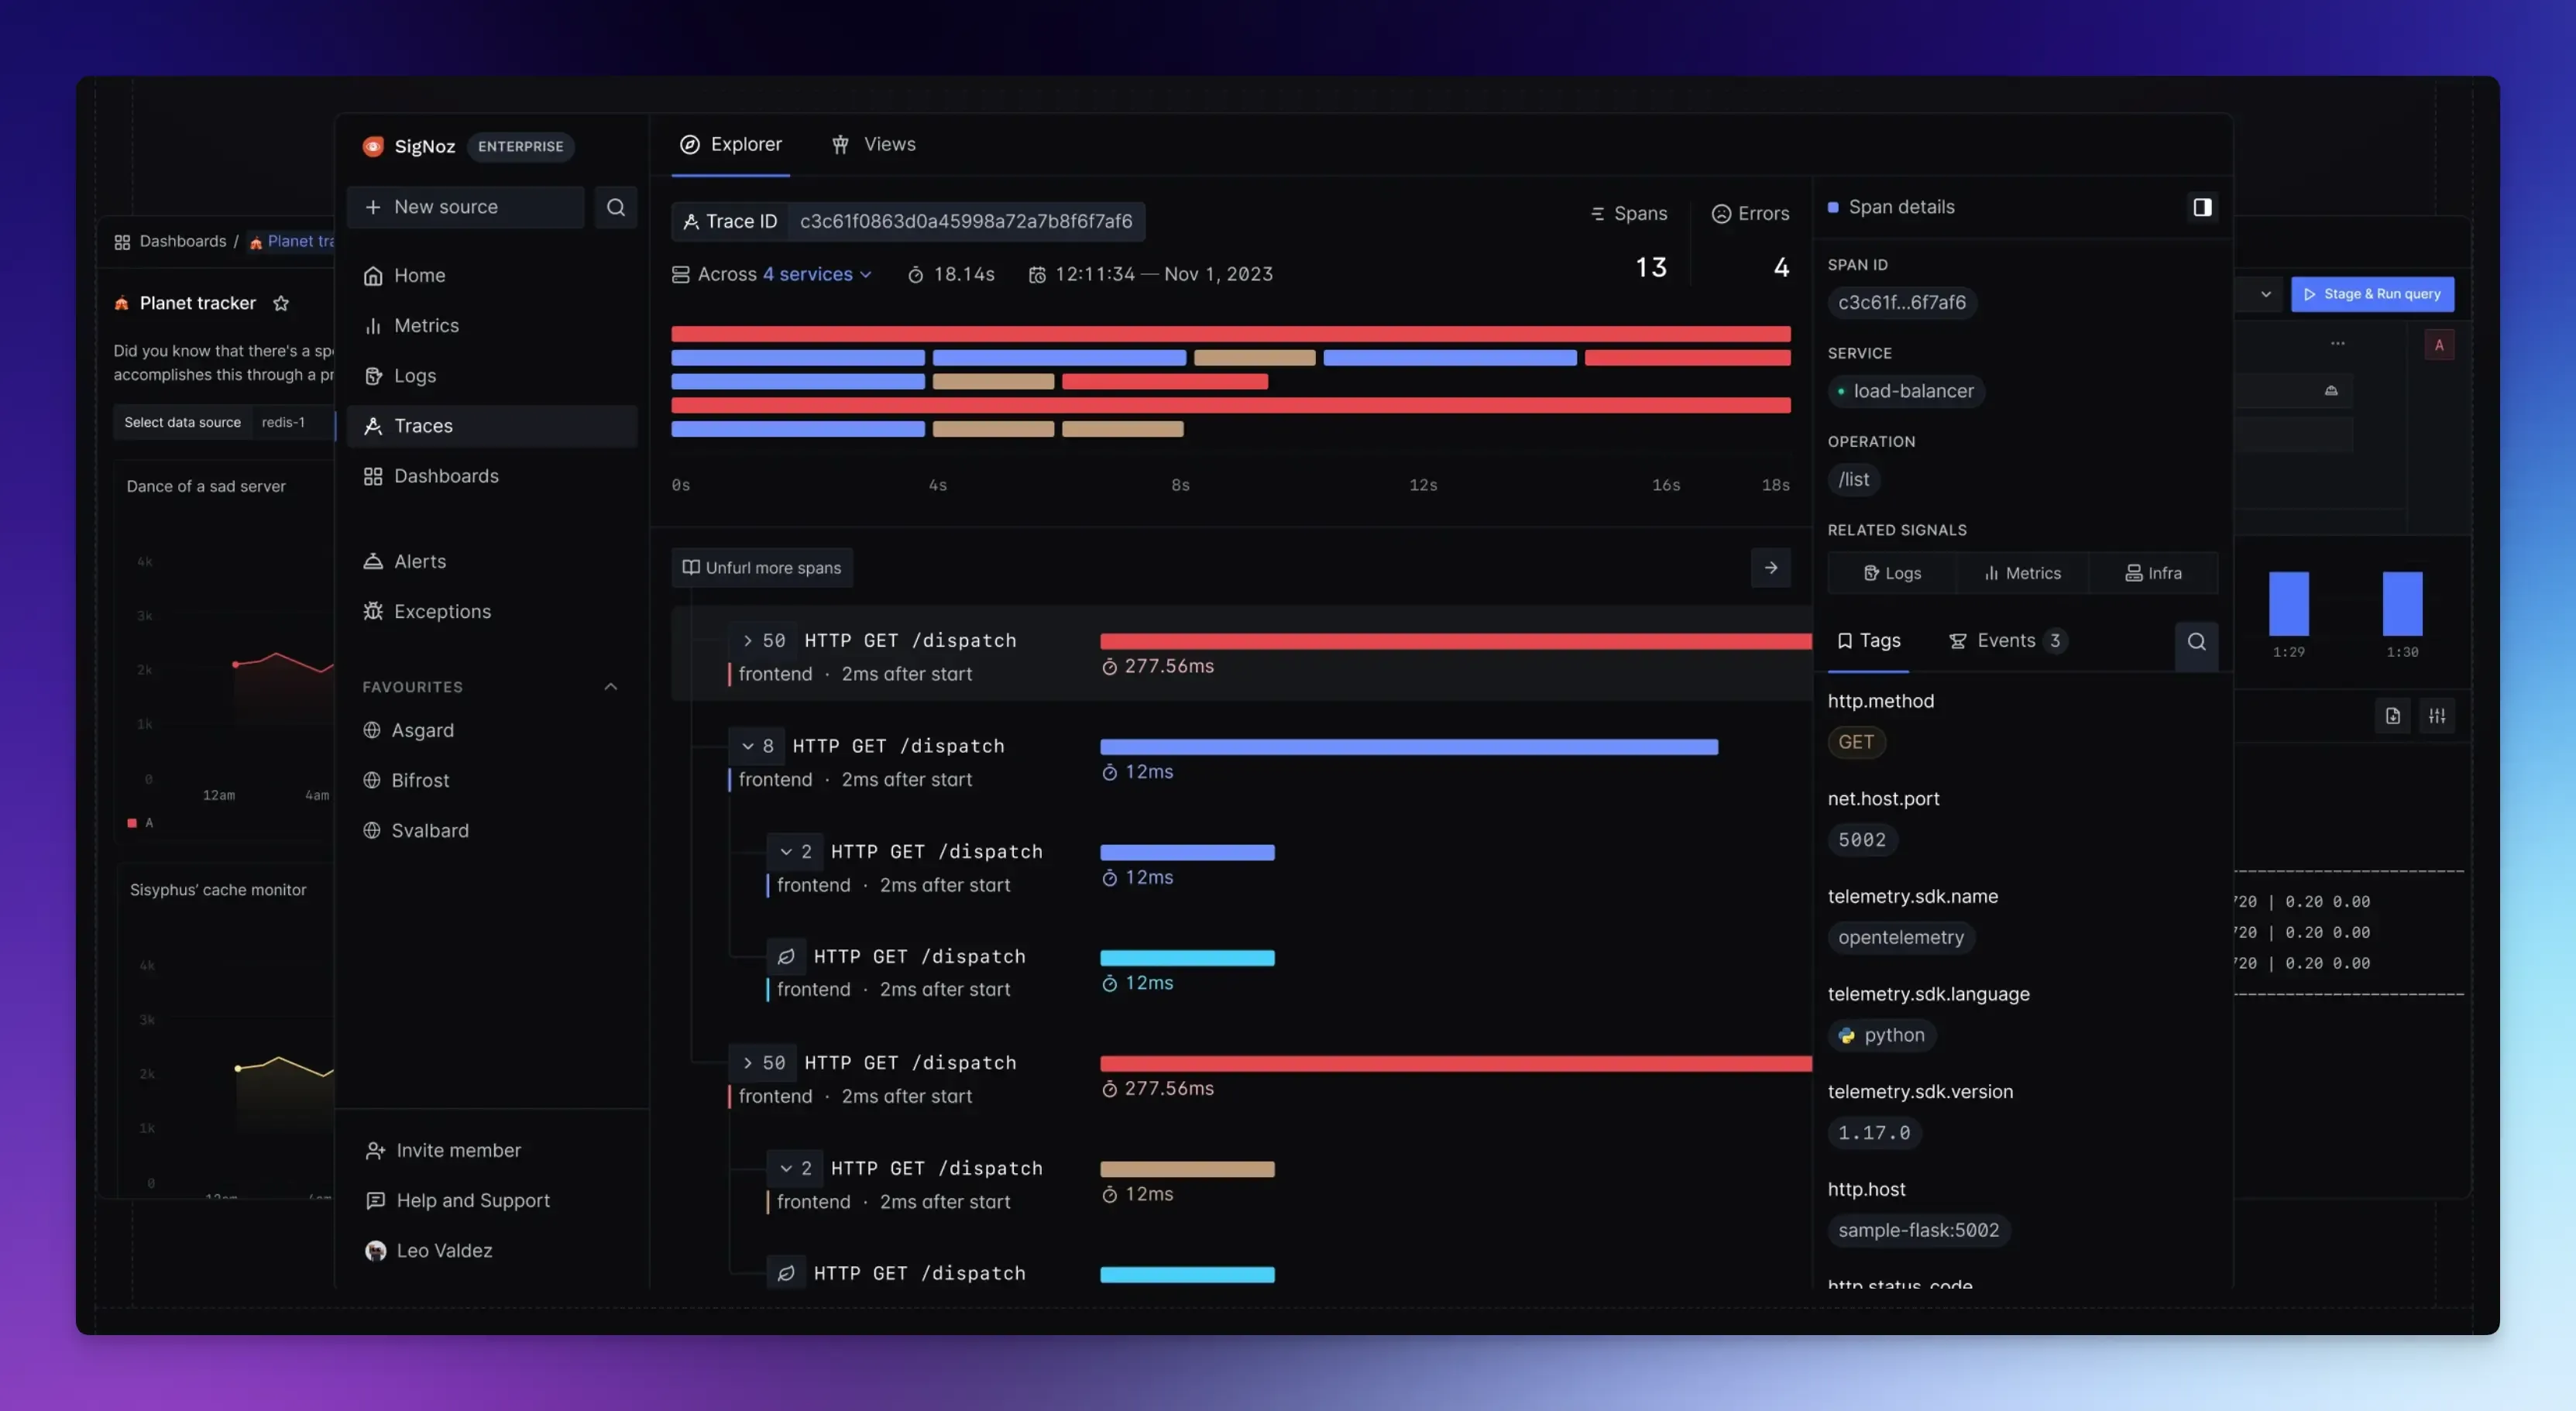
SigNoz is the open-source option that brings metrics, traces, and logs together into one single application.
It builds on OpenTelemetry, so you own your data and instrumentation.
And you can self-host it in your own cloud, keeping all data inside your infrastructure.
Best for: Organizations that want to avoid vendor lock-in and have engineering resources to customize their monitoring stack.
Key features:
- Application performance monitoring and distributed tracing.
- Log management and infrastructure monitoring.
- Custom dashboards aggregate data for specific hosts or user segments.
- Exception monitoring with stack traces and linked span data.
Pros:
- The self-hosted option gives you full control.
- Fast queries on large datasets.
Cons:
- Requires skills for self-hosting.
- Advanced dashboards and alert configurations can take time to learn.
Pricing: The self-hosted version is open source and free. Paid cloud plans start at $49 per month and scale with usage.
PostHog
PostHog started as a product analytics tool, but it is also a perfectly capable error tracker.
If your team already uses PostHog for feature flags, session replays, and product analytics, adding error tracking costs you nothing.
Best for: Product-led engineering teams already using PostHog for product analytics.
Key features:
- Product analytics with funnels, retention charts, user paths, and cohort analysis.
- Captures exceptions with full stack traces.
- Session replays, feature flags, and A/B testing.
- Core Web Vitals and custom event tracking.
Pros:
- Product analytics and error tracking in one platform.
- Self-hosted option available.
Cons:
- Error tracking is not the primary focus.
- No advanced grouping algorithms or distributed tracing.
Pricing: Cloud plans start with a generous free tier and scale based on events and users.
Final Words
Choosing the right error-tracking tool comes down to the problem you are actually trying to solve.
- If you just need stack traces and crash reports, dedicated tools like Rollbar are enough.
- If you manage complex infrastructure across multiple clouds, Dynatrace or Splunk Observability Cloud justify their enterprise price tags with automation and compliance.
- If you want observability without vendor lock-in, SigNoz provides an open-source alternative.
The bottom line is: errors happen to real users with real journeys.
Use Vemetric alongside your error tracker to get the complete picture.
While your error tracker tells you what broke, Vemetric tells you who it affected and what they were doing at the time.
It provides web and product analytics with full user journey visibility, from first visit to feature adoption.
You see which marketing campaign brought them in, which pages they visited, and exactly where they got stuck.
This insight is invaluable to your product team for understanding user behavior and delivering a better user experience, as it shows both the technical failure and the human context around it.
FAQs
Most major tools support mobile crash reporting. Sentry, Rollbar, and Bugsnag all have mobile SDKs.
Many tools offer generous free tiers or affordable entry plans, and open-source options are free when self-hosted.
Error monitoring focuses on exceptions and bugs in code. Full observability tools combine errors, logs, performance metrics, and traces to give you a clearer picture of system health and behavior.
Ready to understand your users?
Start tracking