Hotjar vs Google Analytics: Quick Breakdown (2026)
When it comes to tracking your website’s performance, Hotjar and Google Analytics are two leading options.
Google Analytics has been around for many years as a core tool for measuring website traffic and user behavior.
Hotjar complements this by adding depth to your understanding through visual feedback and individual user experience insights.
While they may appear similar at first glance, these tools serve different primary purposes and deliver unique types of data.
This leads to a common question: should you use both tools, or can you pick just one? Investing in both may seem unnecessary, but choosing only one risks missing critical insights.
This guide will help you see where each tool shines and how they can work together to provide both high-level data and detailed behavioral context to optimize the customer experience.
By the end, you’ll be able to confidently select the right tool (or combination) that fits your current resources and answers your most important questions, ensuring your investment pays off from the start.
Let’s get started.
What is Google Analytics?
Google Analytics is the standard tool for measuring your website’s performance. Its main purpose is to answer quantitative questions about your visitors, their journey, and actions. Such as:
- How many visitors does your site get?
- Which pages perform best?
- How users find your content.
- What actions do they take during their visit?
What You Can Do With Google Analytics
GA organizes your data into clear reports, providing detailed metrics on your audience and performance.
Acquisition Reports help you understand how people find you online and which marketing efforts are working. GA breaks this down into channels like:
- Organic search from Google
- Paid search
- Social media
- Direct
- Referral
Engagement Reports show you which content drives engagement and conversions on your website. You can see which pages are most popular, how long people stay, and what actions (events) they take.
Monetization Reports help you track goals and revenue. You can see how much revenue your site generates by tracking key goals like subscriptions, e-commerce, ad performance, and transaction data.
Other useful features include:
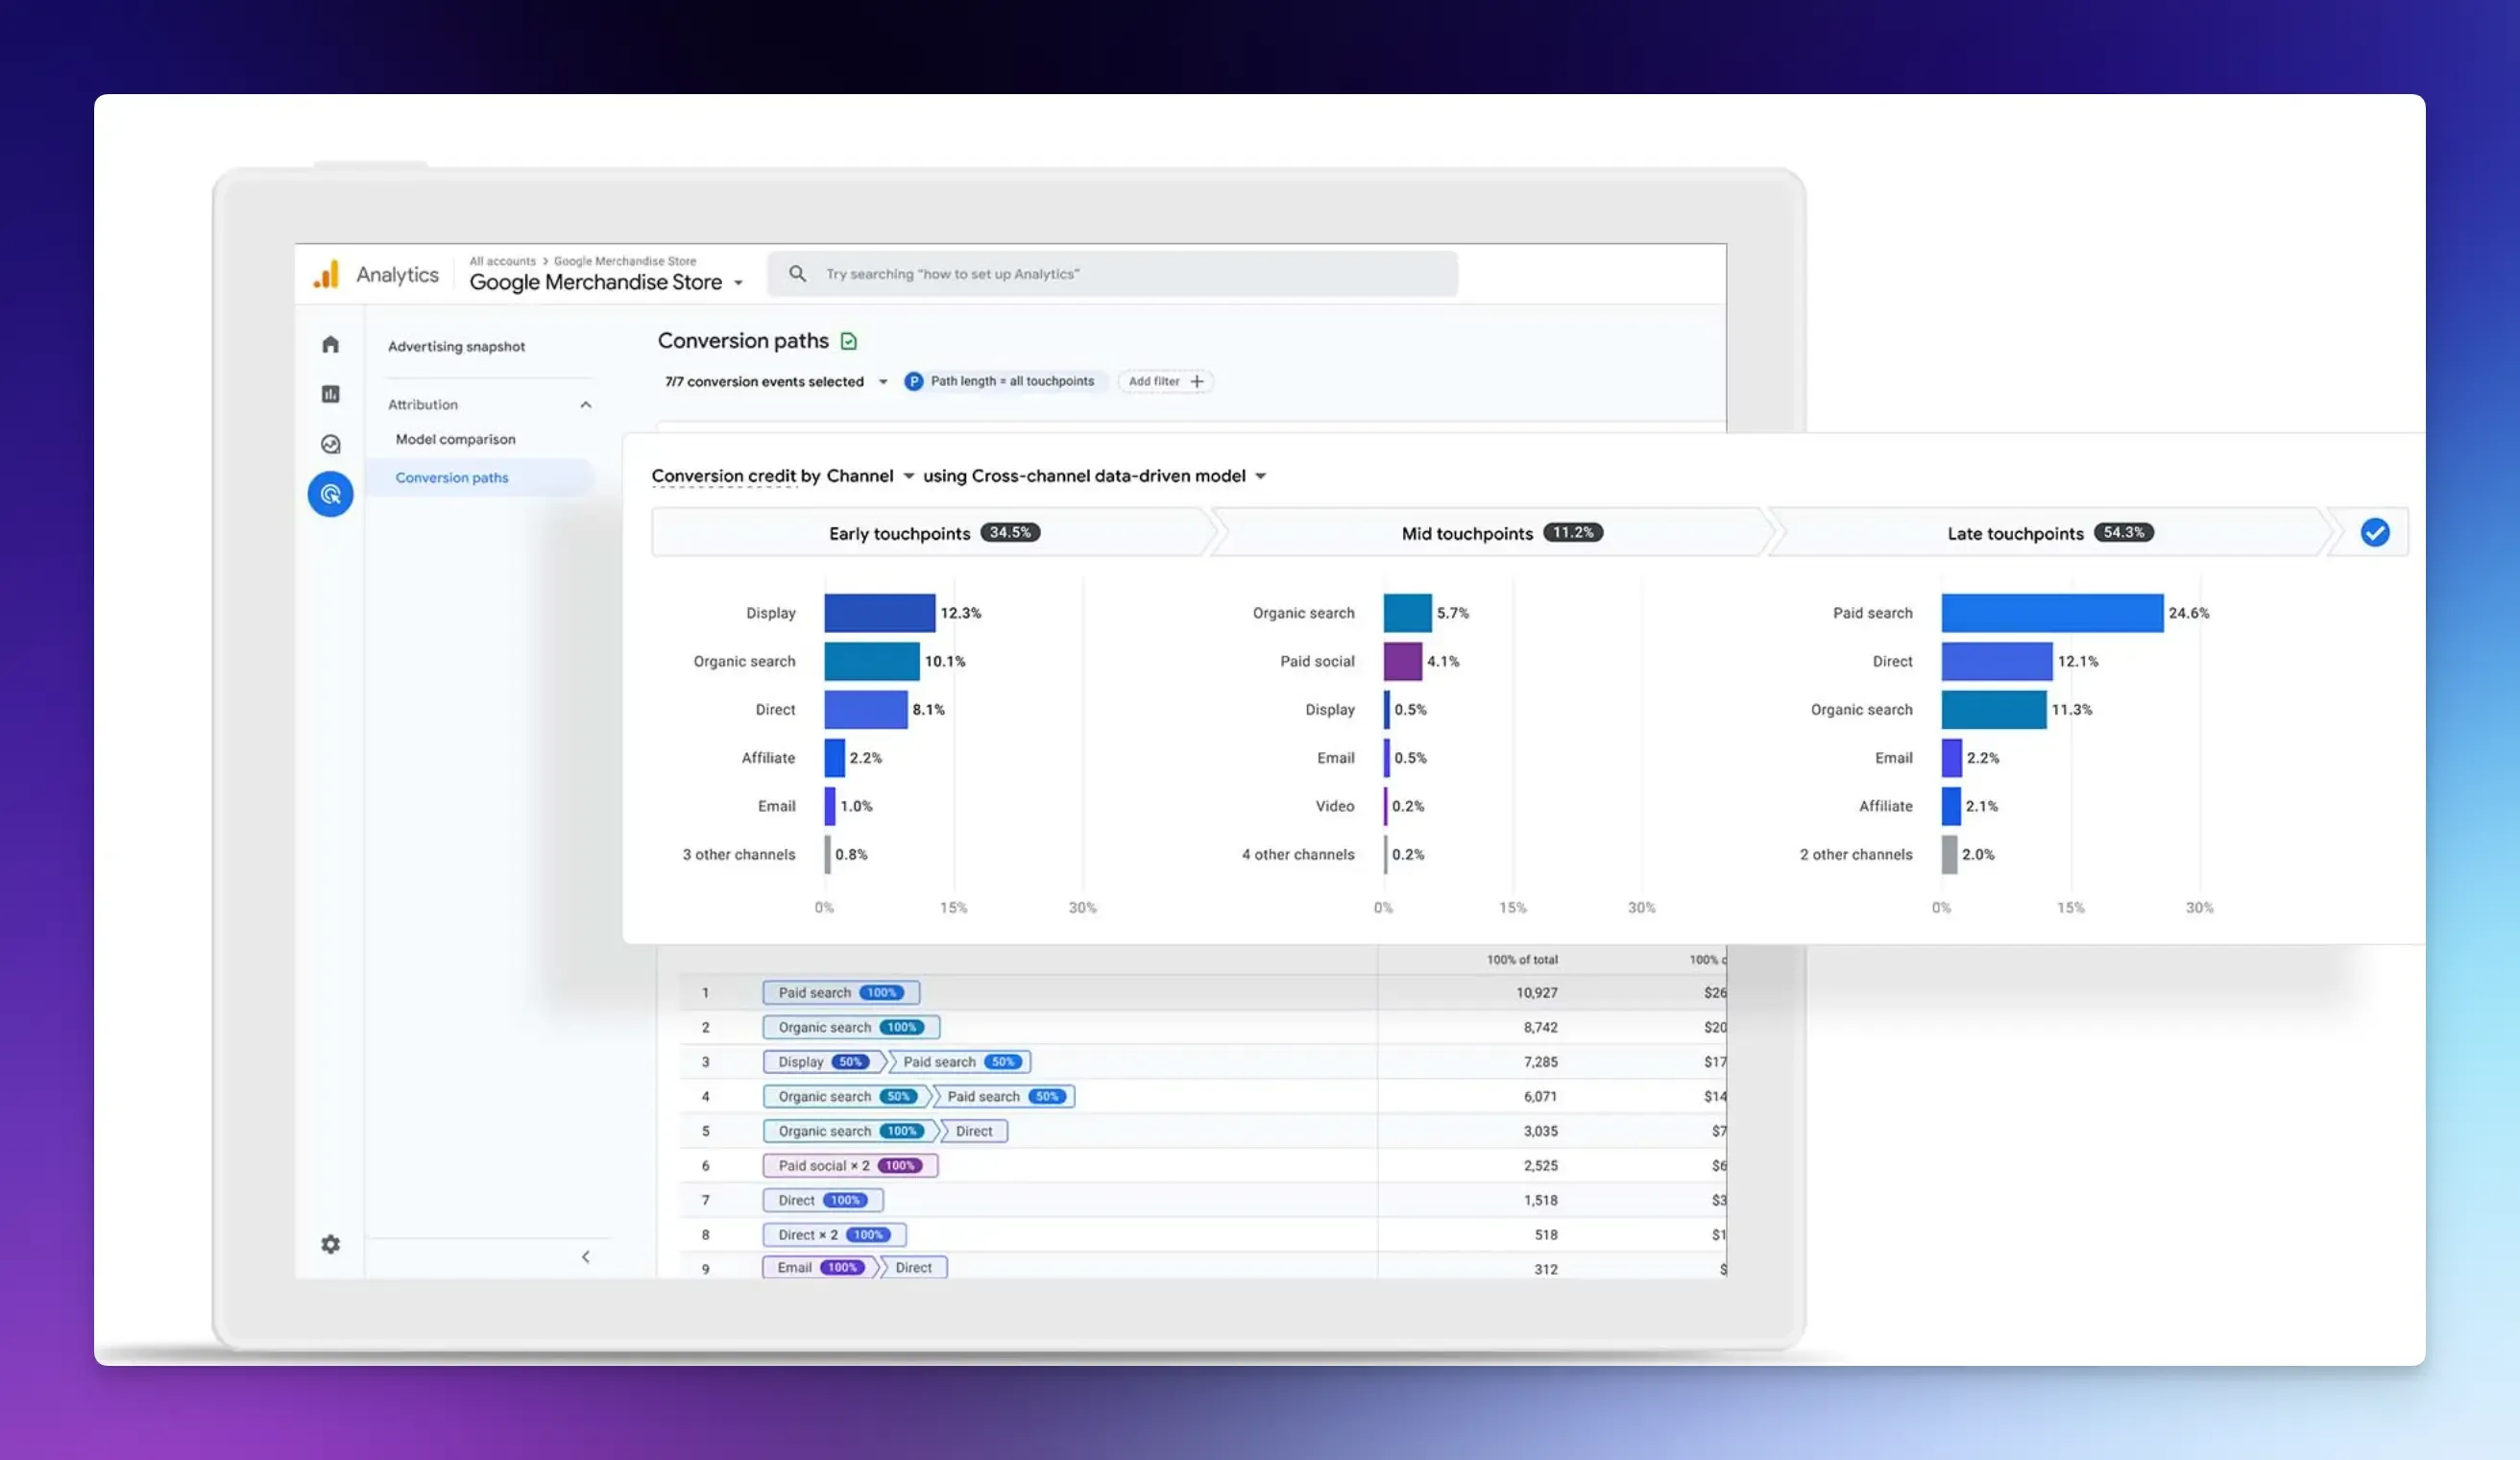
- Funnel and Path Exploration: Reveals the paths users take through your site and where they drop off in a multi-step process.
- Automated Insights: GA uses machine learning to automatically highlight important trends in your data and predict user behavior, helping you spot opportunities or issues quickly.
- Real-Time Data: Watch live activity on your site, ideal for monitoring the immediate impact of a new social media post, ad campaign, or product launch.
- Tag Management: Tracking scroll depth with Google Tag Manager lets you see how much of your page’s content users interact with.
- Integration with Other Google Tools: Connect with platforms like Google Ads to see which ads lead to sales, Google Search Console to understand your search rankings, and Google BigQuery for advanced data analysis.
Pros of Google Analytics
- Free and Powerful: The standard version (GA4) is free and offers a wide range of features for businesses of all sizes. It provides the aggregated metrics you need to track performance, growth, and marketing ROI over time.
- Wide Adoption: It’s the most widely used analytics platform, making it easy to share data with teams or clients.
- Trend Analysis and Reporting: GA helps you understand long-term trends, compare date ranges, and create standardized reports for acquisition, engagement, and conversions.
Cons of Google Analytics
- Learning Curve: The interface can be confusing for beginners, with many reports and technical terms to learn.
- Data Sampling and Limits on Free Tier: The free tier has data limits, such as a 10 million hits-per-month limit. After this limit is exceeded, GA4 samples data to generate reports, which may result in less accurate insights. This can be a challenge for enterprises with high traffic volumes or those that need precise data to make decisions.
- Data Retention: By default, user-level data is retained for only 2 months, though you can configure it to retain data for up to 14 months.
- Privacy and Compliance: GA uses cookies and collects personal data. ****This means you need to ensure your website’s privacy policy and cookie consent methods comply with regulations such as GDPR.
What is Hotjar?
Hotjar is a product experience insights platform that helps you understand how real people interact with your website by providing visual tools and collecting direct feedback.
It shows you the human behavior behind the numbers. If GA tells you your checkout page has a 70% drop-off rate, Hotjar helps you understand why that’s happening by letting you see and hear real users.
Unlike GA, Hotjar focuses on individual experience rather than aggregated statistics.
What You Can Do With Hotjar
Hotjar’s power comes from combining several tools that work together to give you a complete picture.
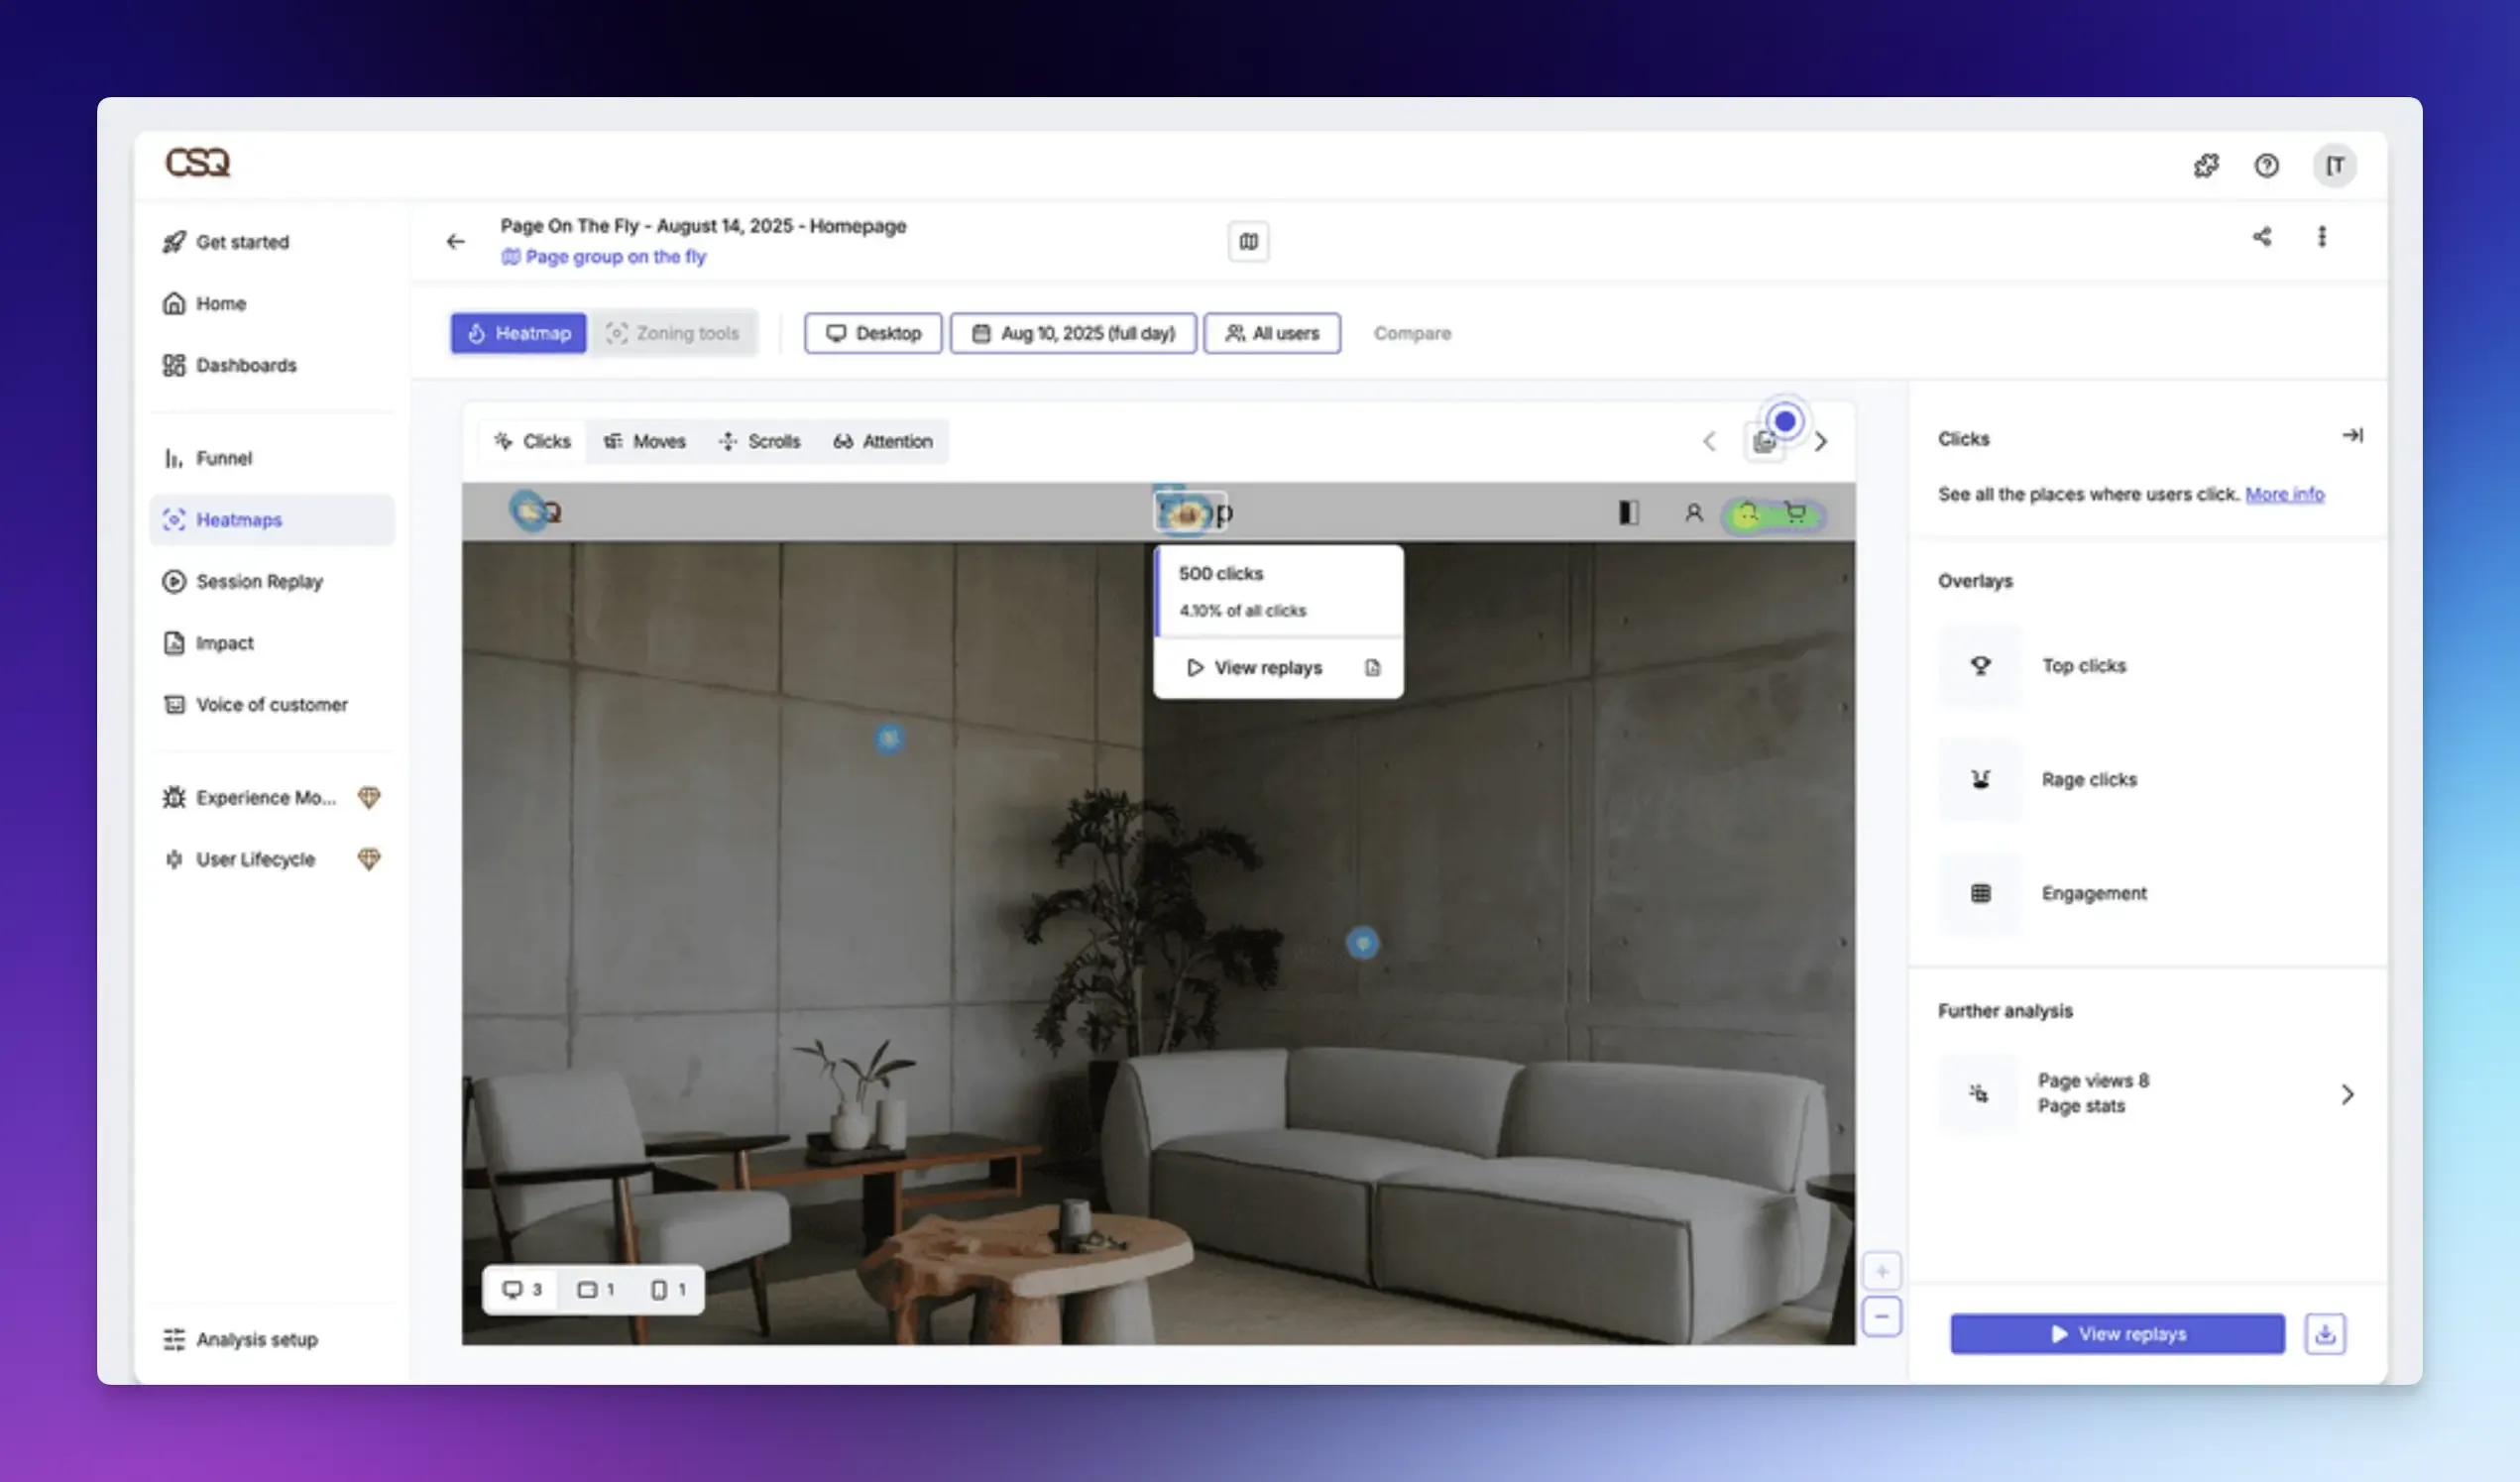
Heatmaps let you see where users focus and how they interact with your website page. You can see:
- Click Maps: Where users click most.
- Scroll Maps: How far down the page users scroll, helping you place key content effectively.
- Move Maps: Where users move their mouse to read certain things.
Other key features include:
- Session Recordings: This tool lets you watch real user journeys to pinpoint exactly where they hesitate, get confused, or encounter errors. You can see anonymized videos of individual users navigating your site, including their clicks, scrolls, and mouse movements.
- Surveys: You can use targeted on-page polls, exit-intent surveys, or embedded feedback widgets to ask users direct questions and collect their responses in real time.
- Funnels: This feature helps you visualize the path users should take and where they drop off at each step. You can then watch recordings of those specific drop-off points to diagnose the cause.
- Live User Interviews with Engage: Hotjar provides a tool for scheduling live 1:1 interviews with your own users or a pool of testers to gain valuable insights. It handles recording and transcription so that you can focus on the conversation.
Pros of Hotjar
- Visual Feedback: Heatmaps and recordings are very easy for anyone to understand without training.
- UX Issue Diagnosis: Hotjar provides human context that pure data analytics cannot. This makes it excellent for finding specific usability problems, bugs, or confusing page elements that affect conversion rates.
- Free Plan: You can start with a basic free plan to test core features. It offers 200k monthly sessions and unlimited heatmaps.
Cons of Hotjar
- Data Volume Limits: Paid plans have monthly session caps. For high-traffic sites, this means you sample only a portion of your traffic, potentially leading to data gaps.
- Not for Performance Trends: You cannot use it to measure traffic growth, track marketing campaign performance over time, or get aggregate metrics that a tool like Google Analytics excels at.
- Can Slow Down Your Site: Adding the Hotjar script can sometimes impact website loading speed.
Which One to Choose: Hotjar vs Google Analytics?
They are not competitors, but powerful tools that complement each other’s capabilities.
Use Google Analytics if:
- You want to track and analyze website traffic, campaigns, conversions, and overall business health.
- You need deep, granular marketing campaign analysis or integration with Google Ads.
Use Hotjar if:
- You want to improve your website design, user experience, and development fixes.
- Your primary need is visual data to identify usability issues and hear directly from your users.
Use Google Analytics and Hotjar Together: Start with GA to identify where your problems are. Then use Hotjar on those critical pages to identify the specific issue and how to solve it.
Vemetric: A Google Analytics Alternative
If you want one tool to see both how users find your site and what they do inside your app, consider Vemetric.
Vemetric is an open-source analytics platform that gives you a complete view of your users journey, from their first page visit to how they use features in your app.
It combines powerful features in a single, simplified tool with a focus on privacy and compliance.
- Track Web and Marketing Performance: It shows you your most visited pages, where your traffic comes from (including referrals from tools like ChatGPT), and your visitor’s top countries.
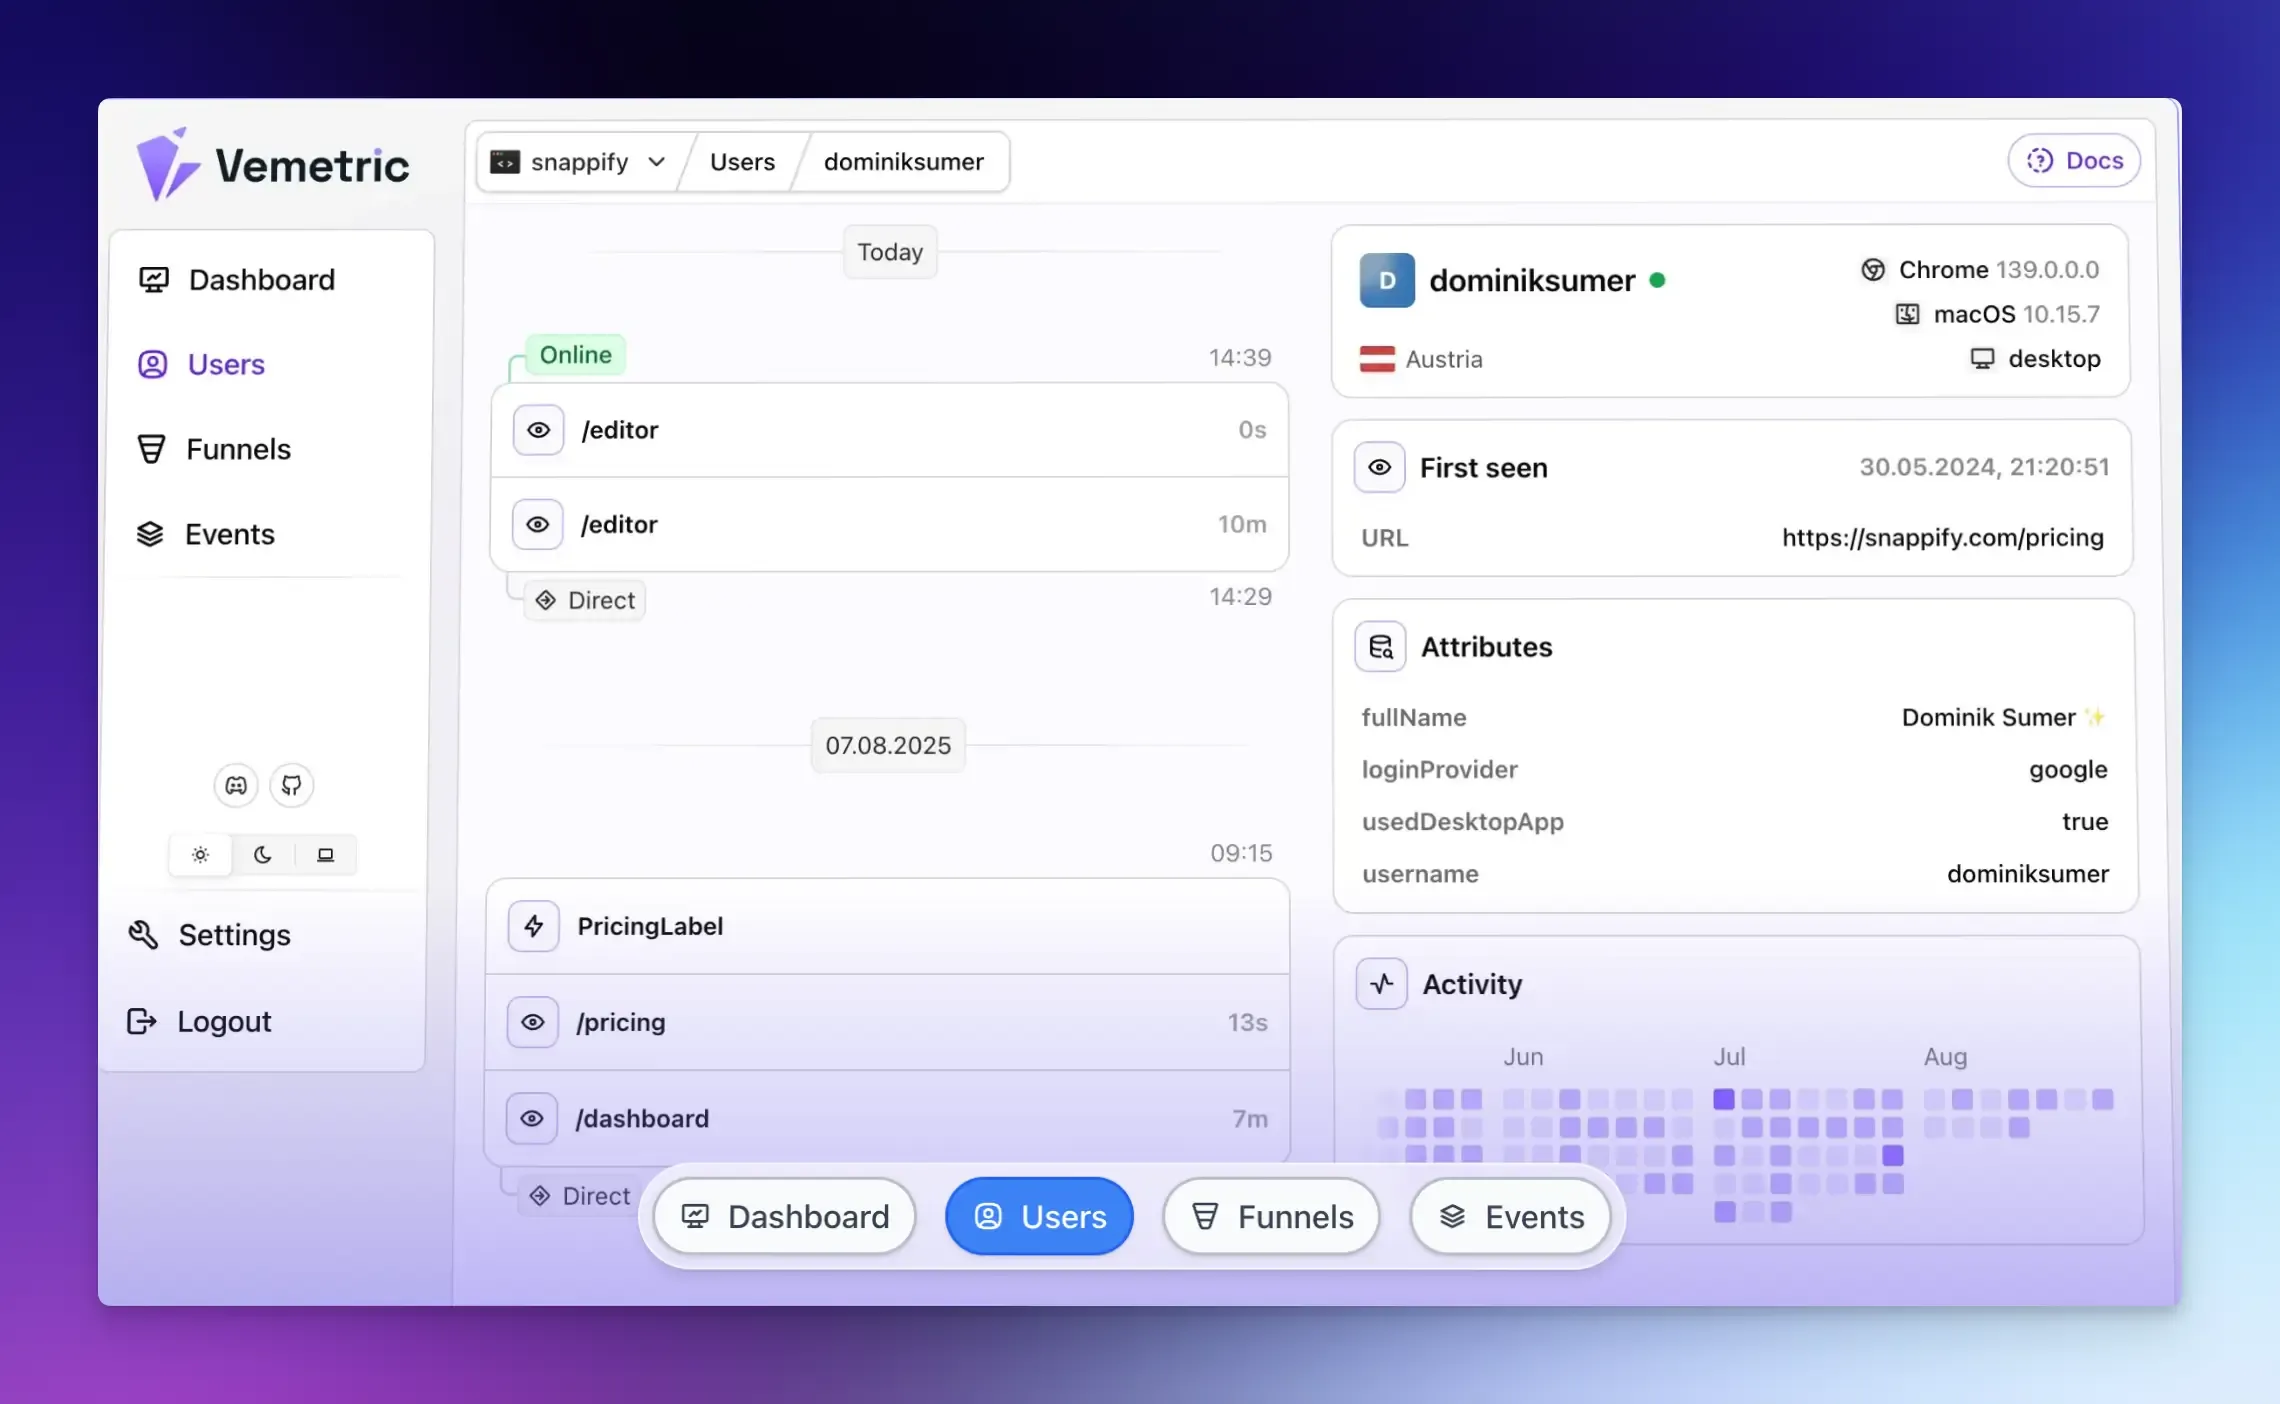
- User Journeys: You can track the full path a single user takes across your website, including their anonymous and logged-in activity. An interactive activity heatmap ****gives you a visual timeline of each user’s actions.
- Funnels: You can build funnels to see the steps users take toward a goal and identify exactly where they drop off. You can also view the progress of individual users through these funnels.
- Event Streams: See every user interaction as it happens in a chronological timeline, with filtering and search options.
- Data Privacy: Unlike GA, Vemetric uses cookieless tracking by default and stores data on EU servers to comply with regulations such as GDPR.
Final Words
Choosing the right analytics tool depends on what is most important to your product and business goals.
While Google Analytics measures your traffic and Hotjar explains user behavior, modern platforms like Vemetric combine both numbers and behavior analytics into a single, privacy-focused dashboard.
This simplifies your team’s workflow and provides clearer data to help you make better decisions and accelerate growth.
FAQs
Yes. You can add both tracking codes to your site. They work independently and do not interfere with each other.
This is because each tool handles bot traffic, ad blockers, page exit behavior, and its distinct sampling model differently. Google Analytics counts sessions, while Hotjar samples recorded sessions based on your plan. The key is to focus on the trends and insights in each tool, not on matching exact figures.
Ready to understand your users?
Start tracking