6 Best Heap Analytics Alternatives for Product and Website (2025)
Choosing an analytics platform is an important decision that can impact how your entire team understands user behavior.
While Heap Analytics offers powerful automatic data tracking, it is not always the right choice for every company.
As your product and website grow, you may find the interface too complex for daily use or require more flexible reporting that Heap does not offer.
If Heap Analytics no longer meets your requirements in terms of cost, ease of use, or functionality, it makes more sense to switch to a different tool.
We have done the hard work for you and evaluated the best Heap Analytics alternatives for product and website tracking, including their features, pros, and cons.
Read on to find a tool that fits the way your team works and helps you track user behavior, measure product performance, and make better choices for long-term growth.
Top 6 Heap Analytics Alternatives
Here are the top alternatives to Heap, along with their key features and pricing, to help you decide.
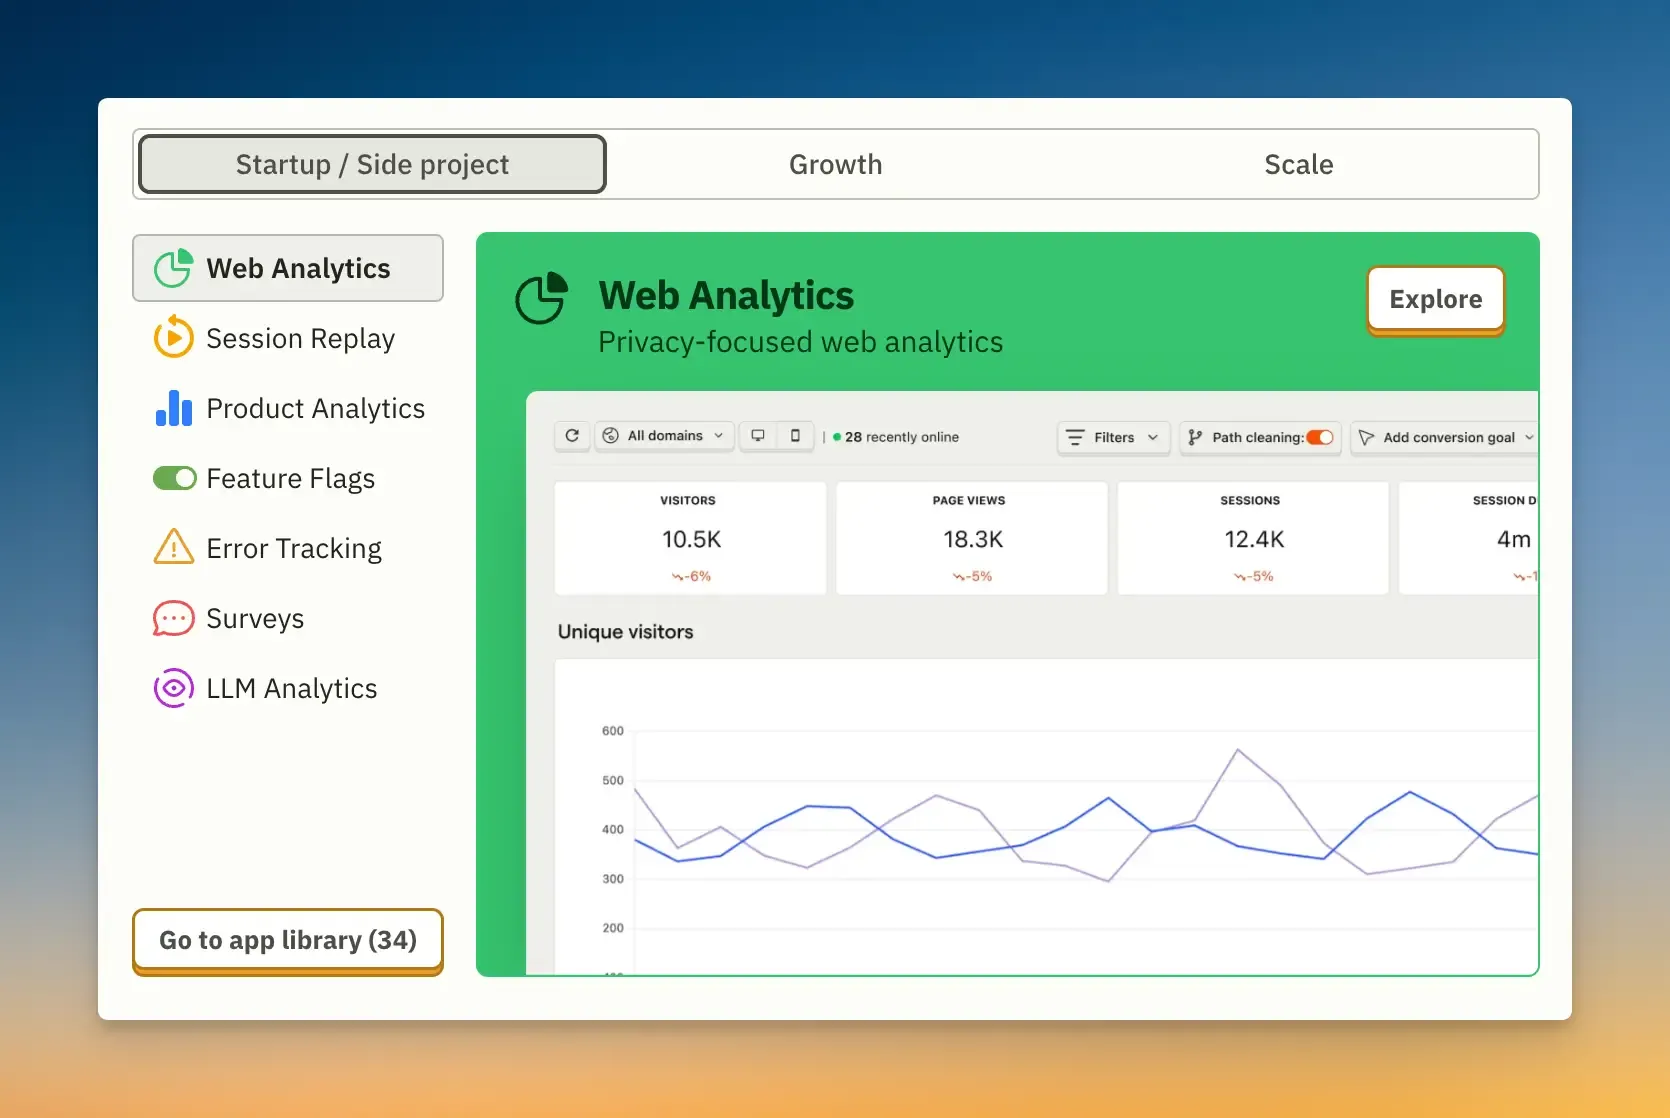
Vemetric
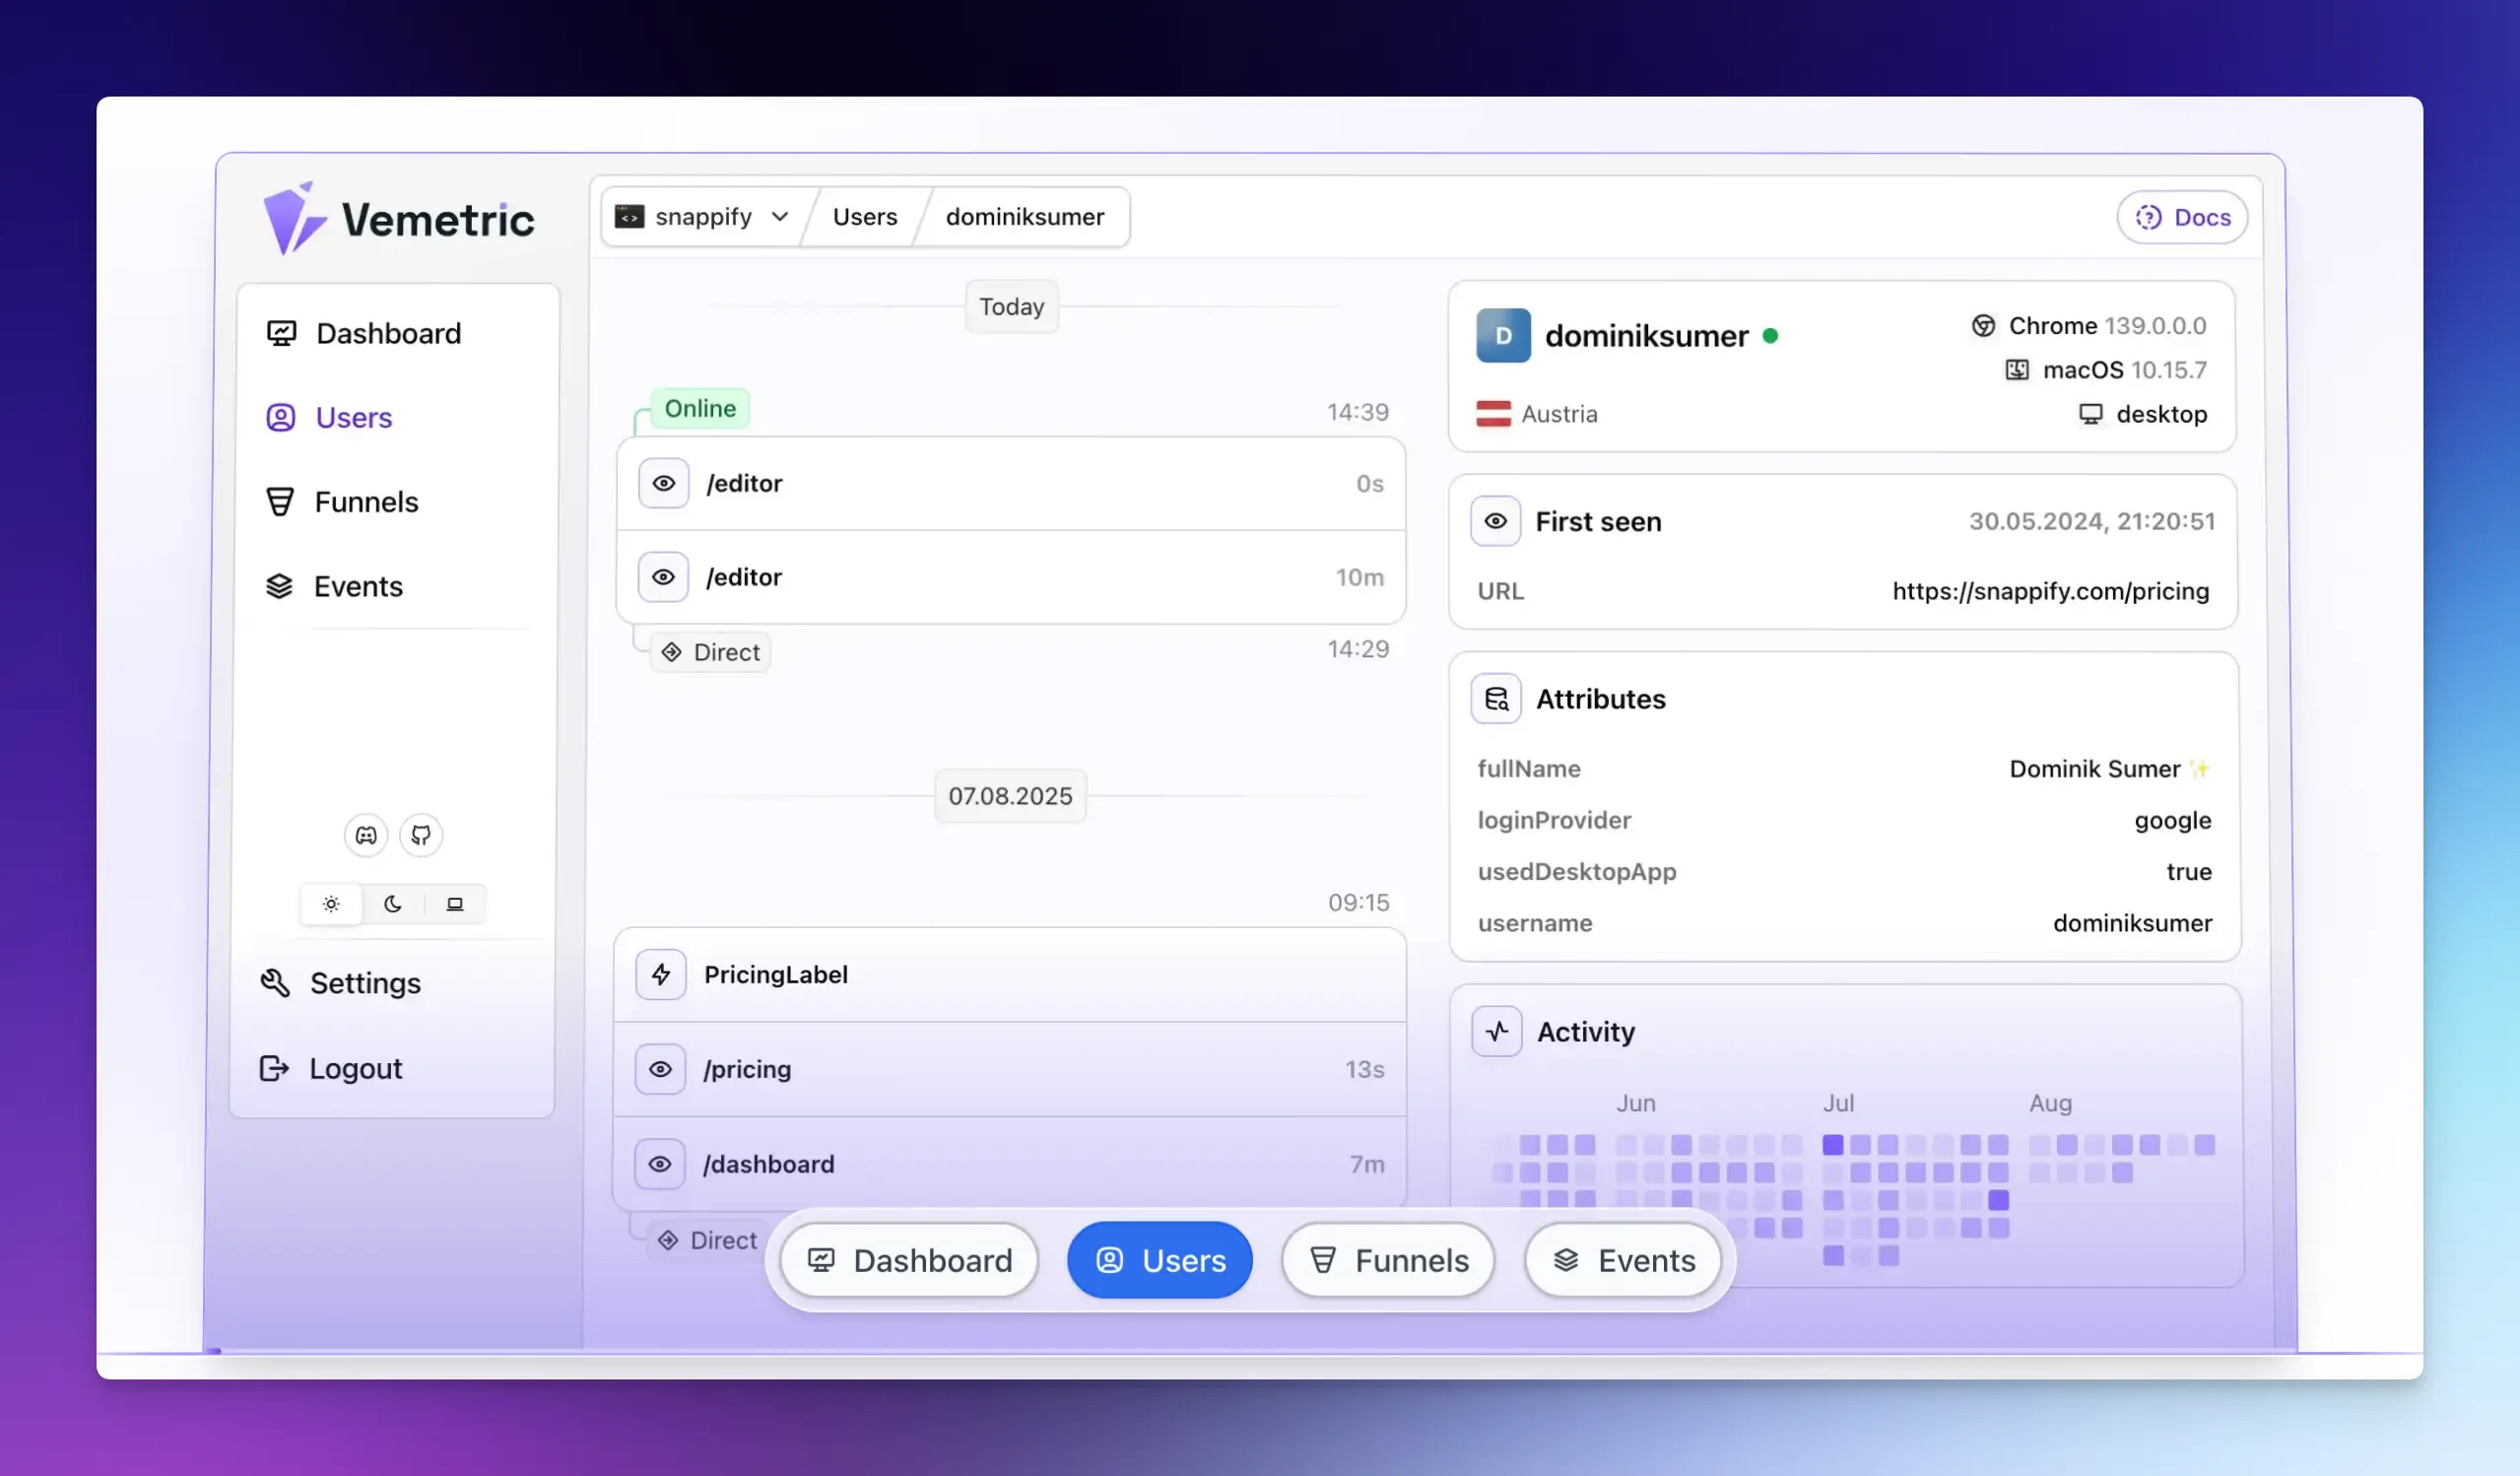
Vemetric is an open-source, privacy-focused analytics tool that provides a unified view of your website’s performance and user interaction.
It combines web and product analytics into a single platform, providing a comprehensive view of the entire user journey.
Vemetric is built with a strong emphasis on data privacy and GDPR compliance, operating on cookieless tracking by default and storing data on EU-based servers, making it a perfect solution for privacy-conscious organizations.
Key Features:
- Web and Product Analytics: Vemetric lets you see standard website engagement metrics like page views, bounce rates, and traffic sources alongside detailed product analytics like individual user paths and custom event tracking in a single dashboard.
- User Journey Mapping: This feature allows you to track the paths of both anonymous and logged-in users across different sessions and devices. It helps you visualize where users engage and where they drop off, providing a clearer picture of the customer journey.
- Cookieless Tracking: Vemetric does not use cookies by default. It employs an anonymized hashing technique with a daily rotating salt to identify visitors without collecting personal data, which simplifies compliance with regulations like GDPR.
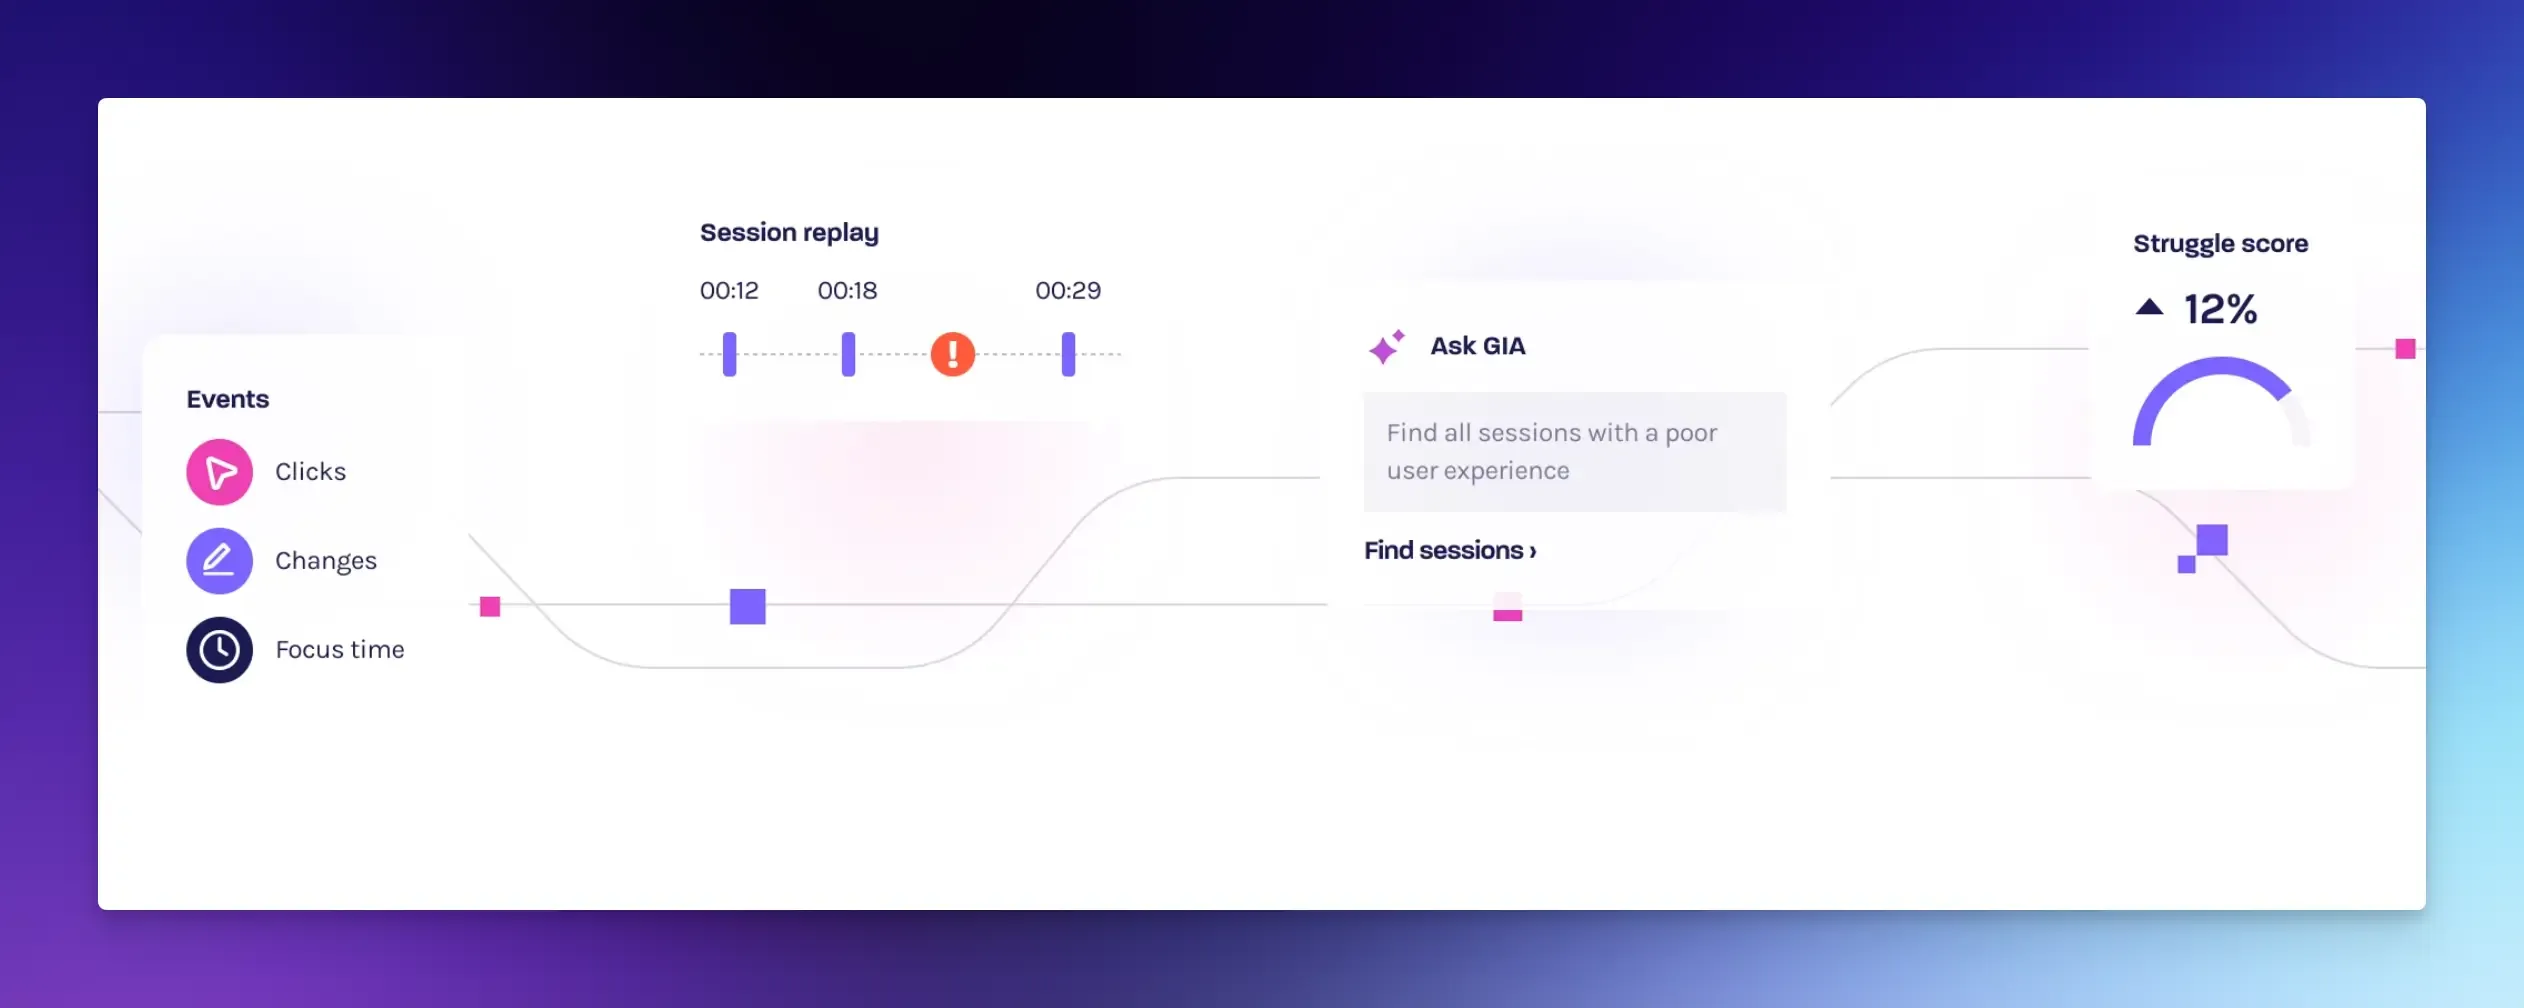
- Funnels and Heatmaps: Build step sequences to see where users drop off and compare segments. You can also view a per-user activity heatmap that highlights days with a higher number of events.
- Real-Time Dashboards: You can view active users, their current pages, and actions as they happen, allowing for immediate monitoring of site activity and campaign performance.
- Event Logging: Track custom events, such as button clicks or video plays, to analyze specific user interactions that are important to your business.
Pros:
- Open-source code for transparency.
- Quick setup and user-friendly interface.
- Affordable option for startups or small projects.
Cons:
- Only available as a cloud-hosted service (self-hosted version is in development).
Pricing:
- Free plan includes 2,500 events per month.
- Professional plan starts at $5 per month for up to 10,000 events.
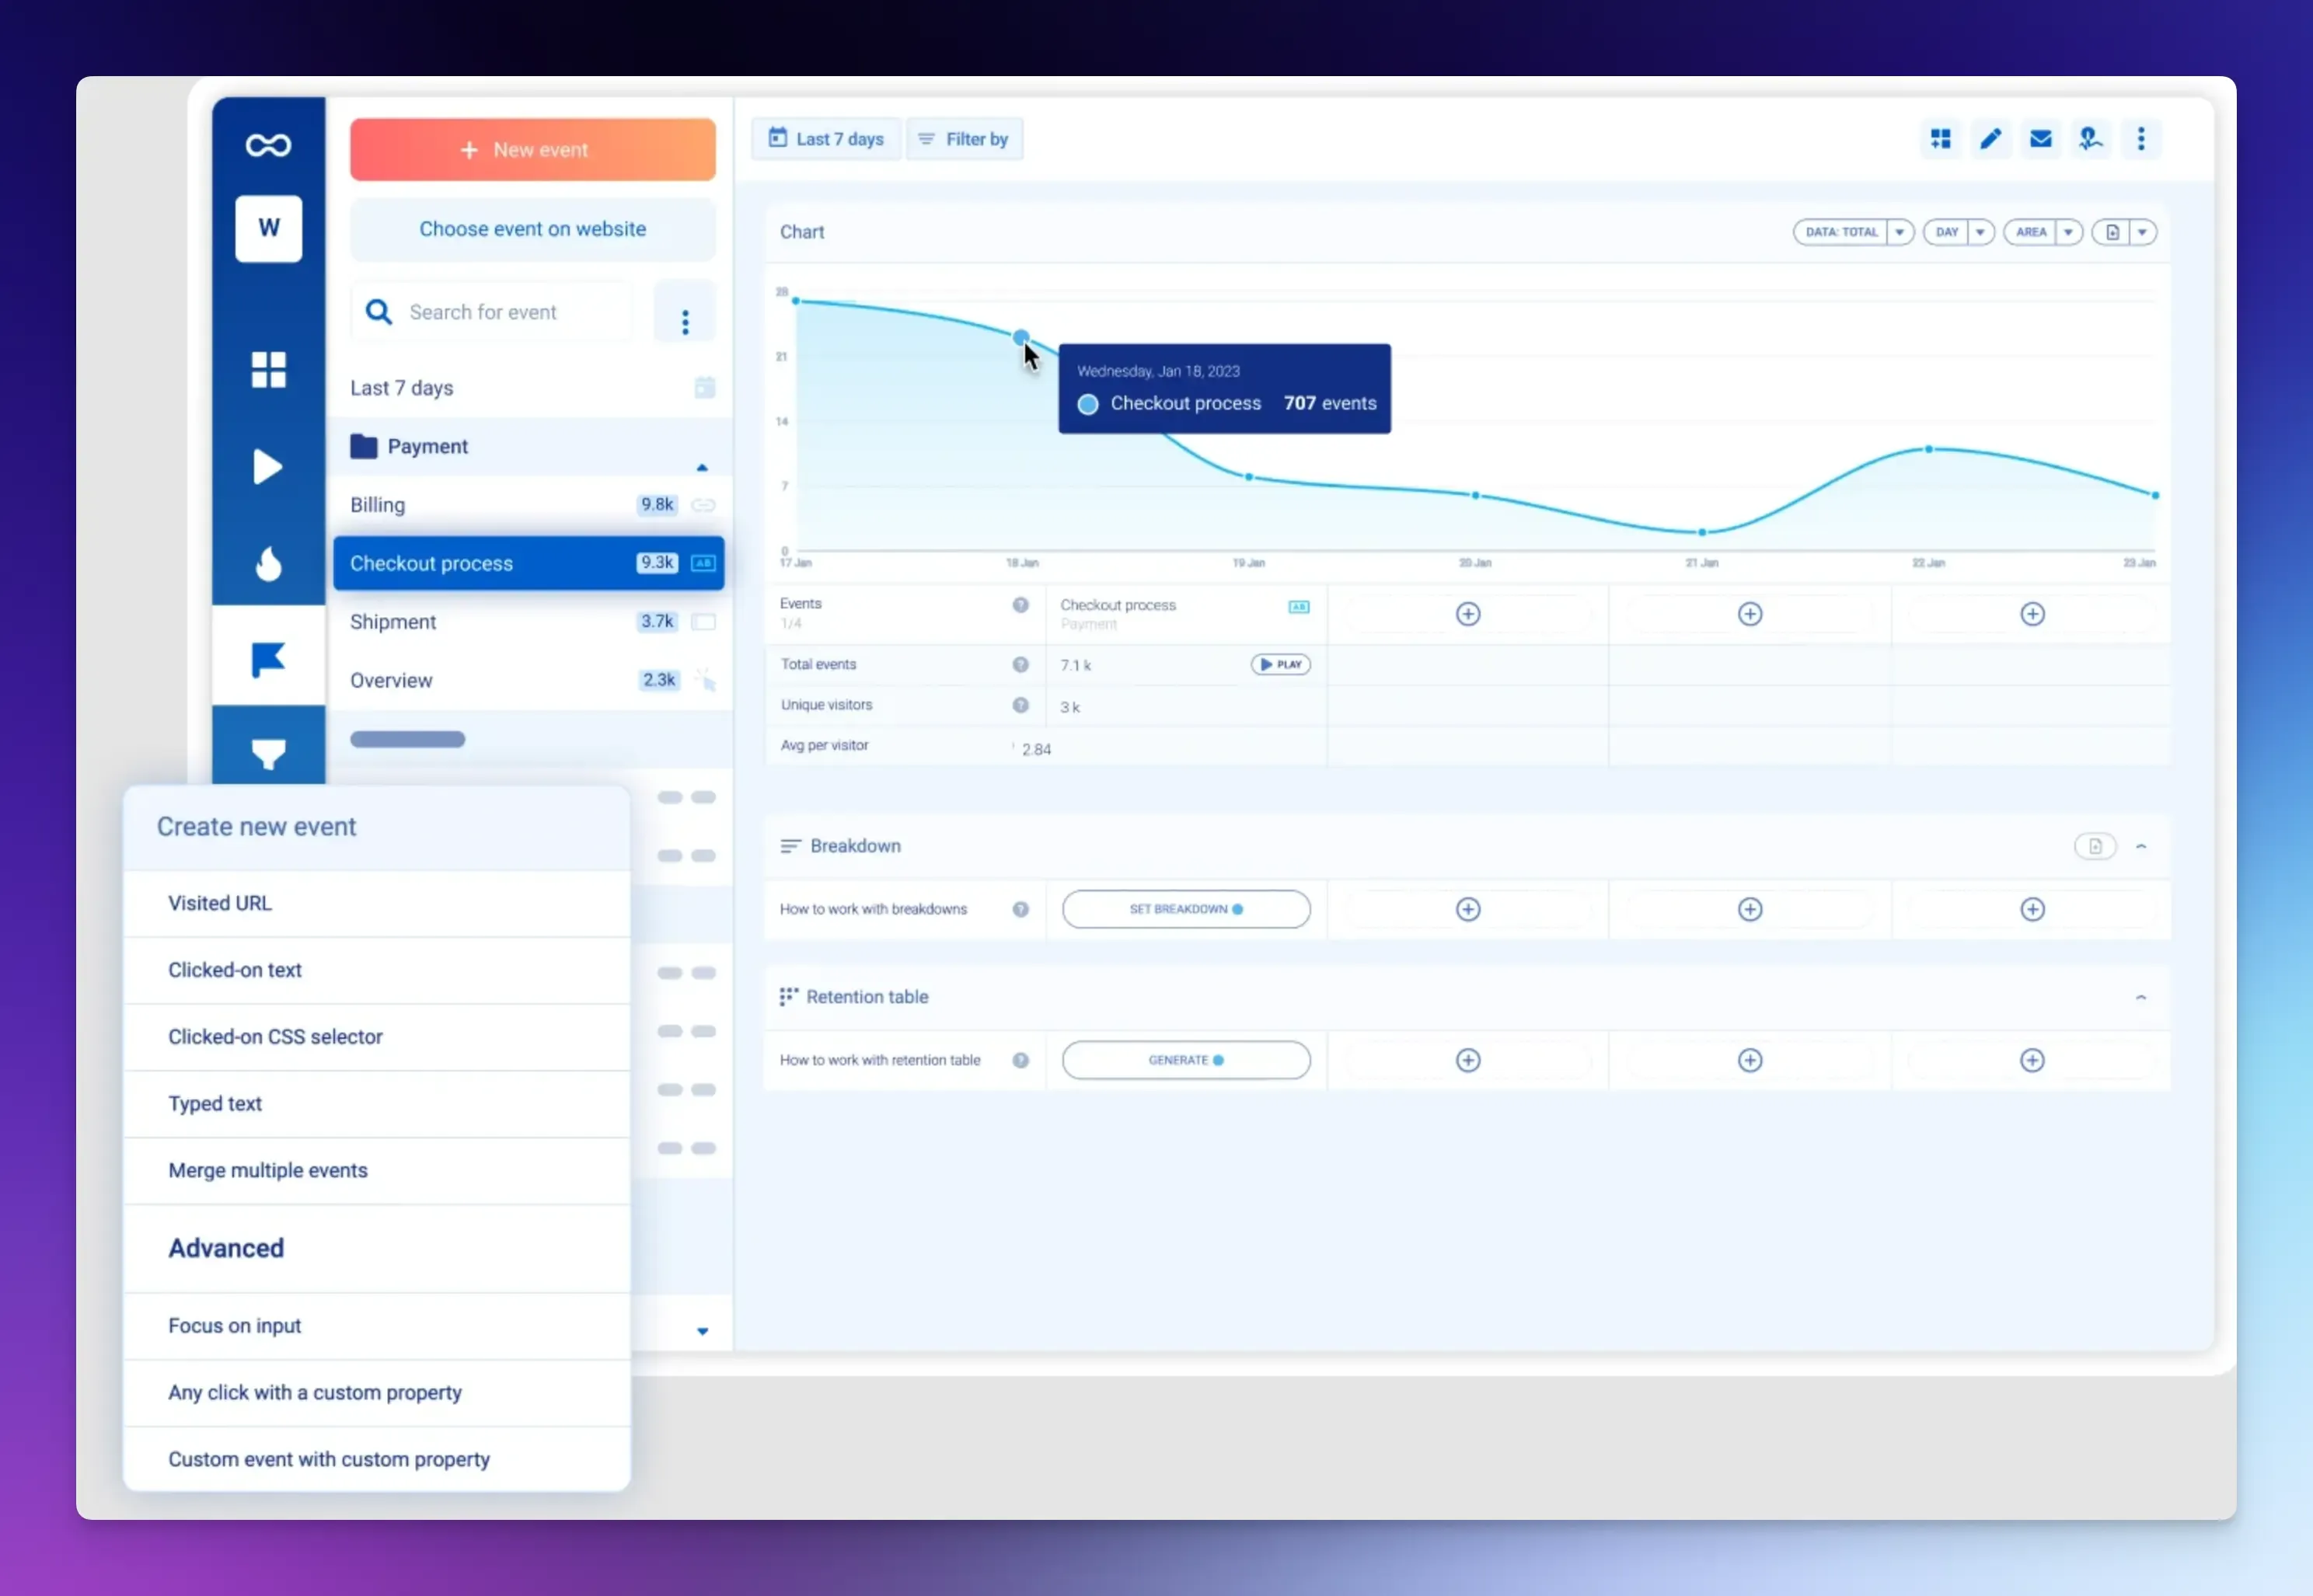
Mixpanel
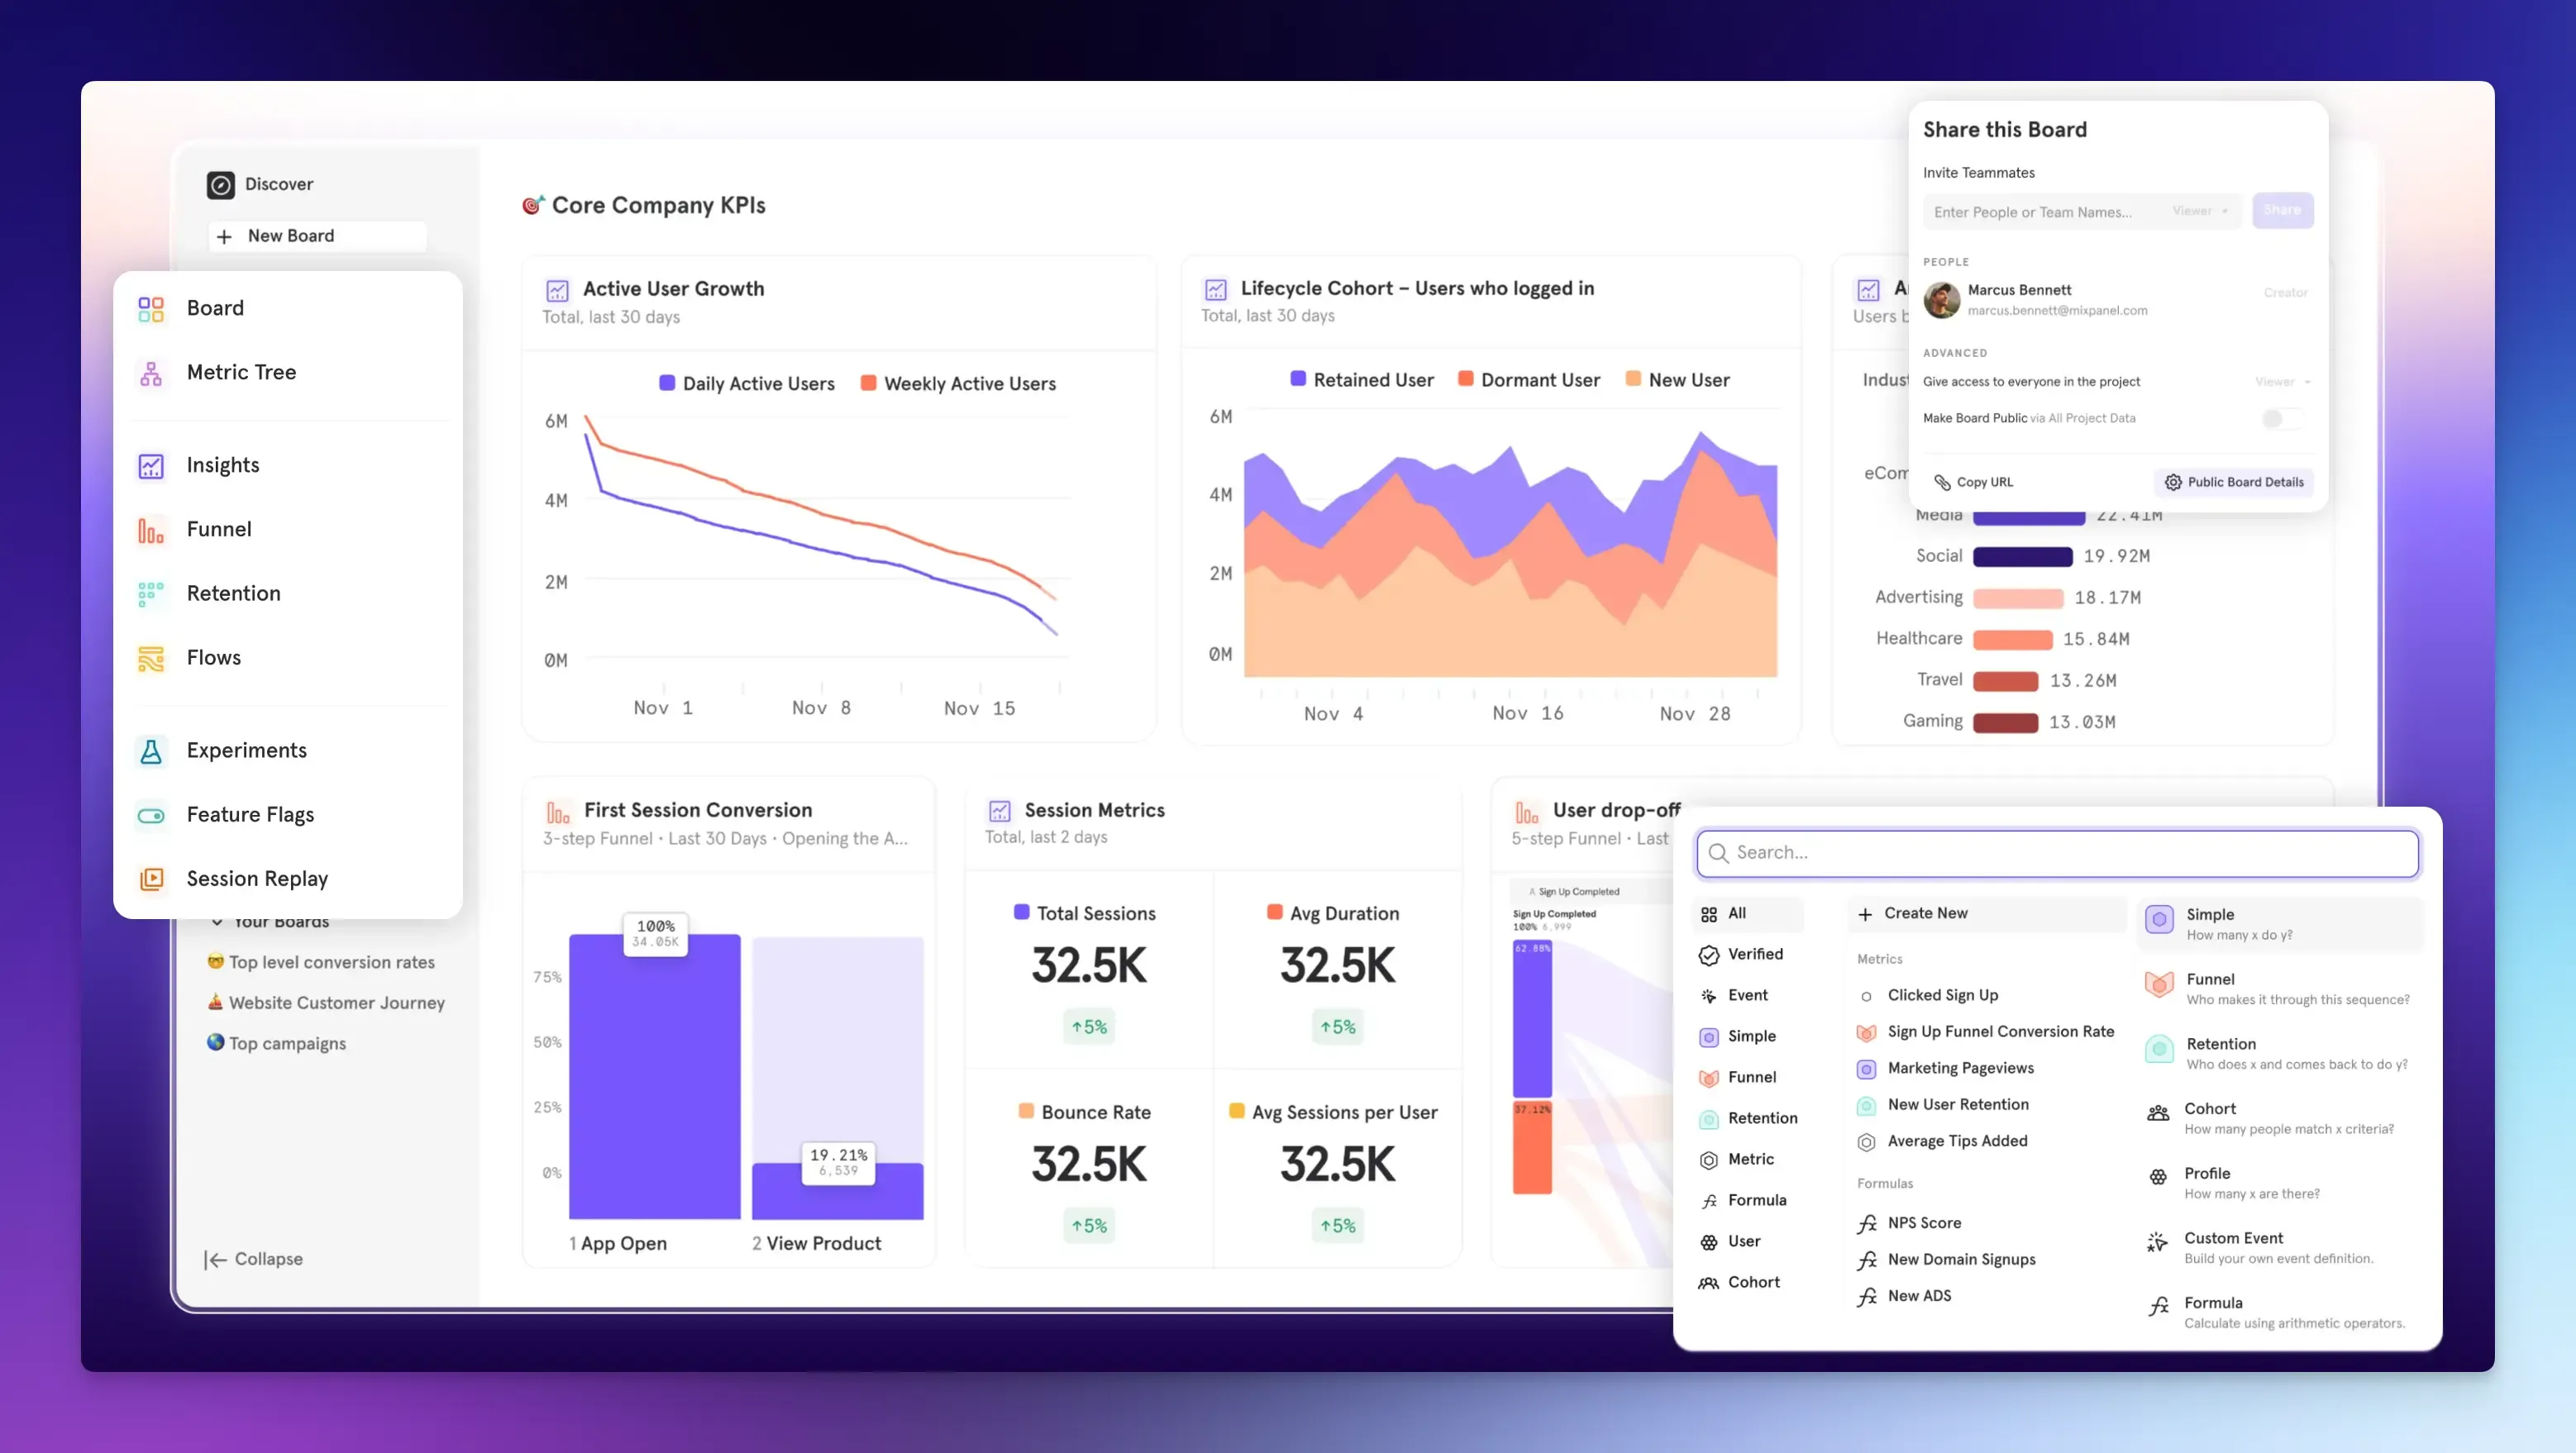
Mixpanel is a product analytics platform that helps businesses understand how users interact with their products.
It is a powerful Heap alternative that includes controlled analysis and built-in A/B testing, but it takes a very different approach to data collection.
Unlike Heap’s automated event capture, Mixpanel requires manual event tracking, which provides more exact control but at the cost of ongoing engineering effort and the inability to examine untracked events retrospectively.
Key Features:
- Product Analytics: Includes real-time insights for general analysis, funnels to identify where users drop off, retention analysis to determine if users return, and flows to visualize the paths users take through your product.
- User Segmentation and Cohort Analysis: Create detailed user segments based on their behavior and properties to analyze how different groups interact with your product over time.
- A/B Testing and Experimentation: Run experiments directly within the platform to test different versions of a feature and measure the impact on your key metrics.
- Custom Dashboards: Build custom dashboards to monitor key metrics and access live event data to see user activity as it happens.
- Session Replays: Watch real user sessions to understand their behavior across platforms.
Pros:
- Offers detailed reporting features for deep behavioral analysis.
- Provides interactive visualizations that make complex data easier to understand.
Cons:
- Steep learning curve for non-technical users.
- Pricing can scale with event volume.
Pricing:
- Free plan includes 1 million events per month.
- The growth plan includes 1 million monthly events free, after which you’ll be charged $0.28 per 1,000 events.
Amplitude
Amplitude is a powerful product analytics platform that helps you understand user behavior within your digital products.
It provides deep behavioral cohorts, feature flags, experimentation, and enterprise-grade controls in one platform.
It’s a strong choice if you have a clear idea of what you want to track and value precision and flexibility over automated setup.
Key Features:
- User Journey Visualization: See the paths users take through your product and analyze event sequences to understand their experience across multiple touchpoints.
- Dynamic Segmentation: Group users into behavioral and predictive cohorts based on their actions and shared characteristics for targeted analysis and campaigns.
- Funnel and Retention Analysis: Visualize how users move through critical flows like sign-up or checkout, and analyze what keeps them coming back.
- A/B Testing: Conduct A/B tests and use feature flags to experiment with new features and measure their impact on user engagement and conversion.
- Session Replay and Heatmaps: Replay user sessions linked to events to gain qualitative insights into user behavior.
Pros:
- Offers granular insights into user behavior.
- Fast query performance and enterprise-level scalability.
- Built-in warehouse exports for historical data storage.
Cons:
- The depth of features and customization options can be overwhelming, especially for non-technical users.
- Pricing can become expensive for high-volume events.
Pricing:
- Free plan offers core analytics for up to 10,000 MTUs (monthly tracked users).
- Plus plan starts at $49 per month for 300,000 MTUs.
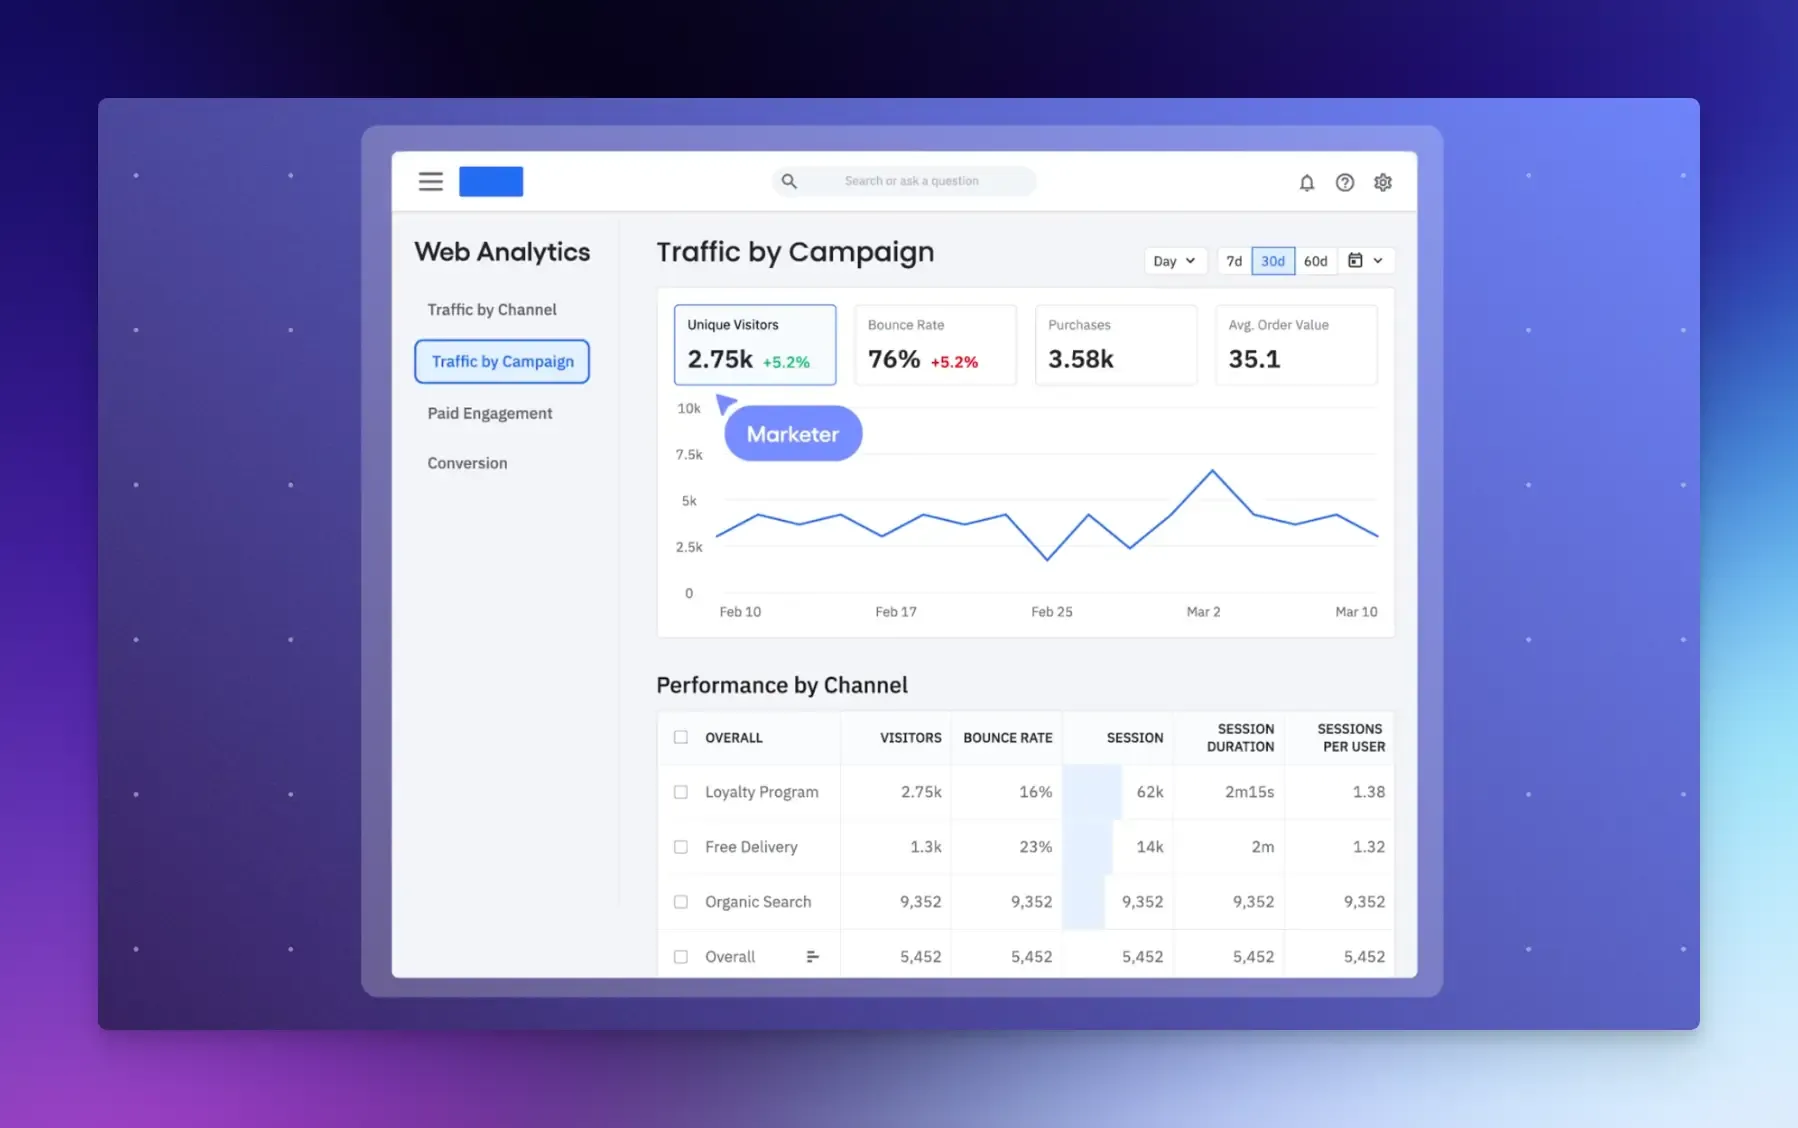
PostHog
PostHog is an open-source platform designed for product teams to build and improve their products.
It combines analytics with an extensive set of tools, including feature flags, A/B tests, and user surveys, thereby reducing the number of separate tools required.
Key Features:
- Product Analytics: Tracks events and user interactions automatically after installing it. You can analyze this data with funnels, paths, trends, and dashboards to understand how users interact with your product. You can even query your data directly using SQL for more complex analysis.
- Session Replay: Watch recordings of real user sessions to gain insight into the user experience and diagnose UI issues.
- Feature Flags and A/B Testing: Roll out features gradually for specific users or segments without new code deployments, test multiple versions of features, and measure the impact of your changes on key metrics.
- Surveys: Gather direct user feedback by deploying in-app surveys.
Pros:
- Comprehensive feature set in one integrated platform.
- Option to self-host for teams with strict data governance and privacy requirements.
Cons:
- Its wide range of features might make the platform feel heavy and complex.
- Self-hosting requires significant engineering resources.
Pricing:
- Free tier offers 1 million events per month.
- Pay-as-you-go pricing model based on usage.
Glassbox
Glassbox is a cloud-based solution designed to help businesses understand and improve how customers interact with their websites or mobile apps.
It stands out for its ability to automatically capture every user interaction, providing deep insights into customer journeys.
The platform uses AI visualization and analytics tools to help product and marketing teams identify user struggles and optimize digital experiences.
Key Features:
- Session Replay: Watch recordings of real user sessions to see exactly what customers do and where they encounter problems.
- Customer Journey Mapping: Utilize funnels, path analysis, and trends to comprehend common user flows and pinpoint where users tend to drop off.
- Tagless Data Collection: Once you install Glassbox on your website, it begins recording user sessions and collecting interaction data in the background, eliminating the need for manual tagging of every element. This makes sure you don’t miss valuable data and can investigate issues you didn’t know existed.
- Heatmaps: See aggregated visual data of where users click, tap, move their mouse, and scroll on your pages.
- Error Analysis and Alerts: Automatically detect JavaScript errors and set up real-time alerts so your team can react quickly.
Pros:
- Strong session replay and error analysis capabilities.
- Automatic data capture.
Cons:
- Complex interface and steep learning curve.
- Recording large numbers of full sessions creates storage and cost implications.
Pricing:
- Custom plans available on request.
Smartlook
Smartlook is a product analytics tool designed to help businesses understand user behavior through visual data.
It includes features such as session replays, heatmaps, and funnels to help product teams capture user interactions, see how users move through pages or app screens, and detect where users drop off without needing overly complicated instrumentation.
Key Features:
- Session Recordings: See replays of real user sessions on your website or app, including every click, scroll, and text input.
- Heatmaps: They offer click, movement, and scroll maps that provide a visual representation of user engagement, making it easy to identify which areas attract the most attention and which are being overlooked.
- Event Tracking and Funnels: Track specific user actions and set up conversion funnels to analyze the steps users take toward a goal, such as making a purchase.
- User Journey Mapping: You can segment recordings with filters to understand the paths users take across your product.
- Crash Reports: Mobile app analytics reveal what happened around crashes or errors, allowing you to trace what the user saw or did just before the issue occurred.
Pros:
- Gives rich visual context with session replays, heatmaps, and event tracking.
- Powerful analytics across both web and mobile apps.
Cons:
- Visual replays can generate storage and bandwidth costs.
- No built-in A/B testing or feature flags.
Pricing:
- Free plan includes up to 3,000 sessions per month.
- Pro plan starts at $55 per month (5,000 sessions/month).
Final Words
Each of the tools listed above offers different trade-offs in terms of usability, feature richness, cost, and control.
What matters most is that you choose the one that fits with your team’s size, technical resources, data requirements, and growth plans.
Use this guide to narrow down your options and try them side by side to find the solution that works smoothly with your processes.
Don’t forget to check out our other guides:
FAQs
The most critical factor is the user interface and the learning curve. A tool can have powerful features, but if your team cannot use it independently to get answers, its value drops. Look for solutions that include easy-to-use dashboards, clear data visualizations, and allow non-technical users to create reports and segments without writing code.
The most budget-friendly options include open-source platforms like Vemetric and PostHog (self-hosted).
Ready to understand your users?
Start tracking